Download
1 / 40
400 likes | 592 Vues
Physics of Fluctuations of Waves in Turbulent Medium. V. I. Tatarskii Zel Technologies & NOAA/PSD vtatarskii@hotmail.com. Abstract.

E N D
Physics of Fluctuations of Waves in Turbulent Medium V. I. Tatarskii Zel Technologies & NOAA/PSD vtatarskii@hotmail.com
Abstract Semi-qualitative description of basic phenomena in wave propagation in a medium with fluctuating parameters is considered. In particular, the fluctuations of phase, spatial and temporal phase differences, angle of arrival, intensity, their correlations and spectra are analyzed for waves in turbulent atmosphere. The simple consideration, based on descriptive geometric optics and its diffractive limitations, allows obtaining all basic relations without complicated mathematics.
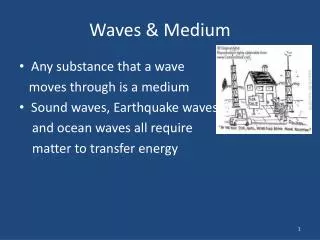
Structure of fully developed turbulence For very high Reynolds numbers Re = UL/ν, where U is a velocity of flow, L is a scale of flow (for instance, diameter of jet or pipe, an elevation above a plane boundary of flow), and ν is the kinematical viscosity, the structure of flow is turbulent. This means that the values of velocity, density, pressure, temperature, and refractive index chaotically vary from one point to another. Here, color schematically represents the value of departure of parameter (say, refractive index) from its mean value. As a rule, the larger is some inhomogeneity, the more intense it is.
Turbulent flow is usually described statistically. If n is the refractive index, the most important for wave propagation in turbulent medium characteristic is so called structure function This function is related to the correlation function by the formula
Why the structure function is more useful than the correlation function for turbulent medium description? Let us consider two points A and B in a turbulent flow A B
If the scale of inhomogeneity is large in comparison with the distance r between points A and B (blue inhomogeneity at the previous slide), it contributes almost the same amount of n in both points, i.e., does not contribute much to the difference n(A) – n(B). If the scale of inhomogeneity is small in comparison with the distance R between points A and B, such inhomogeneity is relatively weak and contributes only a small amount to the difference n(A) – n(B). Thus, the main contribution is caused by inhomogeneities, which scale is of the order of distance R between these points. Because of this, the value of the structure function D is a measure of the intensity of inhomogeneities having scale R.
For very large Reynolds numbers the structure function D depends only on the distance R and is independent of the mutual orientation of points A and B. It was found by A.N. Kolmogorov and A.M. Obukhov in 1941 that the function D has the following shape: There are 3 ranges in this figure: quadratic (left), 2/3 slope (middle) and constant (right). These ranges are separated by the scales l (inner scale, 5 mm in this example) and L (outer scale, 10 m in this example).
Rather often all essential transverse scales of electromagnetic problem, such as radius of the first Fresnel zone, the base of optical or microwave interferometer, diameter of optical or microwave aperture are much larger than the inner scale of turbulence l and much less than the outer scale L. In such situation it is possible to neglect the effect of these scales and consider the idealized model, for which l = 0 and L = Infinity. In this case, we may use the simple model The model of power structure function (power spectrum) corresponds to considering turbulence as a fractal set.
Phase Fluctuations We start considering of wave propagation in a turbulent medium with fluctuations of phase. Fluctuations of Φ are important in such practical problems as optical measuring of distances, transmitting high-accurate time, accuracy of large-base interferometers. The geometric optics approximation is an adequate tool for this problem. We consider the ray intersecting inhomogeneities of refractive index. If deviations of refractive index from unity are small, it is possible to neglect refraction effect and consider the ray as a straight line, because curvature of ray is the second order effect.
After passing a single inhomogeneity having scale Δx and deviation of refractive index from unity equal to Δn, the ray obtains an additional phase shift equal to ΔΦ = k Δx Δn, where k = 2π/λis a wave number. After passing Ninhomogeneities the total phase shift is equal to The mean value of Φ is 0, because mean value of Δn is zero. For the mean square of Φ we obtain: But the second sum vanishes because the fluctuations in different volumes are uncorrelated. Thus,
Which Δx we must choose? We already mentioned that the larger is inhomogeneity, the stronger is fluctuation Δn. Thus, the main contribution is provided by the largest possible inhomogeneities, having the size of the order of outer scale L of turbulence. Thus, we must choose Δx = L. All terms in the last sum are equal and we may write But the number of inhomogeneities N is equal to the ratio of total distance X to L. Thus, We may present the last formula in a little different form, if we substitute where C is the constant, entering in the 2/3 law for refractive index structure function.
This formula has the form We inserted in the last formula some unknown numerical coefficient M, because all previous reasoning was performed only with the accuracy of indefinite coefficient. The value of M can be obtained only by more rigorous theory.
Phase differences fluctuations Fluctuations of spatial or temporal phase differences are important for many practical problems: measurements of angle of wave arrival, resolution of images, interferometry. Let us consider two parallel rays in a turbulent medium separated at distance ρ. The most Effective inhomogeneity Large inhomogeneity provides the same phase shift to both rays and does not contribute to phase difference ρ The most effective inhomogeneity Contribution to phase difference from these inhomogeneities is small
Let us consider contribution to the phase difference provided by inhomogeneities of different scales. If the size of some inhomogeneity is small in comparison with the distance ρ, it may contribute only to phase shift along a single ray. Thus, such inhomogeneity contributes to a phase difference. The most important contribution will be provided by the largest inhomogeneities of such type, i.e., by inhomogeneities of size about ρ. The inhomogeneities having the size much larger than ρ, are stronger, but they provide the same contribution to the phase shifts for both rays. Thus, contribution to the phase difference from such inhomogeneities will be small. Therefore, the most important contribution to the phase difference are due to the inhomogeneities of the size about ρ. According to the 2/3 law, the deviation of n from unity is of the order of
Now we can calculate the total contribution of essential inhomogeneities to the phase difference. We must choose r = ρin the last formula and obtain The mean value of ΔΦ = 0, and for the mean square of ΔΦ we have The number of essential inhomogeneities N = X/ρ, where X is the total distance from the source of wave to the receiver and ρ is the longitudinal scale of essential inhomogeneities, which for isotropic turbulence is equal to its transverse scale. Thus, where some unknown numerical coefficient K was introduced.
Let us find such transverse distance ρ, for which the variance This value is called “radius of coherence.” We find Coherence radius plays an important role in the problem of resolution of telescopes and other optical devices. Only if where D is diameter of aperture, there exists a possibility of coherent summation of waves in the focal plane. If different parts of aperture send incoherent waves to the focal plane, and it is impossible to achieve diffraction limit of the lens resolution. The important parameter is a ratio of coherence radius to the radius of the first Fresnel zone. For this ratio it is easy to find
Angle of arrival fluctuations The angle of arrival is related to the phase difference. If we measure the phase difference by interferometer having the base ρ and the angle between the wave vector of incident wave and the normal to the base of interferometer is γ, the phase shift δ = kρ sin γ appears. Thus, for small γ, Phase shift ρ γ Wave front Thus, fluctuations of angle of arrival and phase differences are determined by the formula
Dependence of on ρ is shown in the following plot in the semi-logarithmic scale Decreasing of with increasing ρ is caused by the effect of averaging fluctuations over the interferometer base (or aperture of telescope).
shows unlimited increasing of fluctuations of γ Formula for while ρ tends to zero. This result is incorrect, because the 2/3 law is valid only for r > l. If ρ becomes less than l, the 2/3 law changes for If we repeat the derivation of for this case, we obtain the following result for the case ρ < l: We may suggest the interpolating formula, working for all ρ:
The plot of this function is presented in the following Figure: Variance of angle of arrival fluctuations in entire range of ρ. The case ρ < l corresponds to the aperture less than inner scale of turbulence.
Temporal correlation and spectrum of angle fluctuations Let us consider a temporal fluctuations of the angle of arrival. The angle of arrival in some moment t isdetermined by the pair of rays and inhomogeneities located at these rays. At the moment t + τall inhomogeneities will be shifted to a new position and instead of them a new inhomogeneities will cover our two rays. t 1 2 t + τ 3 4 At the moment t these inhomogeneities were located at the positions 3 and 4, opposite to a wind direction.
Let us consider the temporal correlation function of the angle of arrival γ. We have We can use the algebraic identity and present the correlation function in the form But we already determined the variance of the phase differences for an arbitrary separation between two rays:
For the rays 1 and 4 we must instead of ρ substitute ρ +Vτ, where V is the transverse component of wind. For the rays 2 and 3 we must substitute instead of ρ the value Vτ – ρ, and for pairs 1, 3 and 2, 4 we substitute instead of ρ the value Vτ. The formula for autocorrelation function of γ takes the form This function for KC^2X=1, V=500 cm/s, ρ = 5 cm, and l = 0.5 cm is shown in the following Figure:
The auto-correlation function of the angle of arrival fluctuations.
The spectrum of γ is determined by the formula Zeroes in the spectrum are caused by the presence of difference in the definition of γ (for the case of interferometer). In the real spectra these zeroes will be filled in because of wind fluctuations. The straight line in the spectrum corresponds to dependence.
Intensity fluctuations In geometric optics, the product of intensity by the cross-section of beam (ray tube) is constant. Intensity is determined by the cross-section. The small cross-section The large intensity The large cross-section The small intensity The shape of a beam is determined by distribution of refractive index in space.
Inhomogeneities of refractive index play role of random lenses focusing or defocusing light. Initial intensity Final intensity Less intensity Negative lens Positive lens It is known that for a spherical lens the focal distance F is equal to ratio of the curvature radius ® to (n-1), where n is the refractive index of lens material. For turbulent inhomogeneities the curvature radius is of the order of scale R of inhomogeneity. Thus,
Thus, It follows from 2/3 law that Let us calculate the intensity change after passing a single inhomogeneity. δR α α R F X and We have
Thus, the change of the intensity is determined by the relation Using the obtained formula for δR we obtain It is clear from this formula that the smaller is the scale of inhomogeneity, the larger is the changing of intensity. Thus, the most important contribution to the change of intensity is provided by the smallest possible inhomogeneities of the order of inner scale l of turbulence. Thus, we must set R = l in the last formula. We also introduce a random number ξ, which accounts that the sign of fluctuation of refractive index is random. Thus, for the contribution of a single j-th inhomogeneity to intensity fluctuation we obtain
The total change of intensity is determined by the sum For the mean square of relative fluctuations of intensity we obtain The last step is to substitute N = X/l. The result is This formula was obtained by geometric optics approach and is valid if the geometric optics is true for this problem.
The effect of diffraction at inhomogeneities leads to spreading of all rays. At the distance X from the inhomogeneity the sharp boundary of ray tube spreads to the size l X it is possible to neglect a diffraction and use the If geometric optics result. But if diffraction compensates the focusing effect, and the inhomogeneity of the scale l does not produce change of intensity. Thus, the minimal scale of inhomogeneities, which still may cause the intensity fluctuations, is Thus, in this case we must replace the inner scale of turbulence l in the formula for intensity fluctuations for
The resulting formula has the form Here, k = 2π/λis the wave number. It is possible to write a simple interpolation formula which provides transition from geometric optics case to diffraction case: More rigorous theory provides some numerical coefficients in above formulae and another type of transition from geometric optics range to diffraction range of distances.
Diffraction regime Geom. Optics regime Dependence of intensity fluctuations on distance for λ = 0.63 μ, l = 5 mm, Transition from geometric optics regime to diffraction regime takes place at the distance X = 40 m.
Saturated Intensity Fluctuations Comparison of the experimental values of with the theoretically predicted value shows that there is a good agreement between them if . But in the region where the experimental value of does not increase while increases and remains approximately constant.
The region is called the region of strong or saturated fluctuations. It starts at the distance where the theoretically predicted value of becomes unity. Let us consider the ratio of coherence radius to the radius of the first Fresnel zone. This value was found above: It is clear from this formula that in the region of weak fluctuations, i.e., , the radius of coherence is large in comparison with the radius of the firs Fresnel zone, while it is small in comparison with in the region of strong fluctuations. This is clear from the following plot.
The radius of coherence (red) decreases and the radius of the first Fresnel zone (blue) increases while the distance X increases. At some distance the coherence radius becomes less than the radius of the first Fresnel zone. Saturated (strong) fluctuations Weak fluctuations
Previously we found that the most important for the intensity changes inhomogeneities have size of the order of . Such inhomogeneity caused focusing or defocusing of a beam. This focusing (defocusing) is possible because the inhomogeneity acts similarly to a lens, which coherently summarizes all wave field at its surface. Such situation is possible only if the field, incident at a lens, is coherent, i.e., if But in the region where the coherence radius is small in comparison with the scale of lens, different parts of lens transmit (radiate) incoherent waves. Because of this, such lens is unable to focus / defocus radiation. Wave front
It is convenient to call the wave field for which as degenerated wave field. The highly degenerated field ( ) can not be focused and for such field it is impossible to obtain a sharp image in the focal plane. If we return to the intensity fluctuations, we may conclude that only the inhomogeneities located in the initial part of the propagation path may produce intensity fluctuations. All inhomogeneities, which are located in the region of strong fluctuations, can not focus or defocus the wave and because of this they have no (or have very little) influence on . But these inhomogeneities continue to contribute to decreasing of radius of coherence. This qualitative picture explains the phenomenon of strong fluctuations, but the corresponding rigorous theory is rather complicated and is based either on the theory of random Markov fields or diagram technique.
For more detailed information concerning the discussed problem, it is useful to refer to the following publications (the simplest are listed prior to more complicated). 1. Tatarskii V.I. Review of Scintillation Phenomena. In Wave propagation in Random Media (Scintillation). Edited by V.I. Tatarskii, A. Ishimaru, V.U. Zavorotny. Copublished by SPIE Press and IOP, 1993. 2. S.M. Rytov, Yu.A. Kravtsov, V.I. Tatarskii. Principles of Statistical Radiophysics. vol. 4. Wave Propagation Through Random Media. Springer-Verlag, 1989. 3. V.I. Tatarskii. The effects of the turbulent atmosphere on wave propagation. Translated from the Russian by the Israel Program for Scientific Translations, Jerusalem, 1971. Available from the U.S. Dept. of Comm., Nat. Tech. Inf. Serv., Springfield, VA, 22151 4. V.I. Tatarskii and V.U. Zavorotniy. Strong Fluctuations in Light Propagation in a Randomly Inhomogeneous Medium. In Progress in Optics, vol. XVIII, edited by E. Wolf, North-Holland Publishing Company, Amsterdam - New York - Oxford, 1980.
This presentation may be downloaded from the website http://home.comcast.net/~v.tatarskii/vit.htm