Download
1 / 20
240 likes | 1.25k Vues
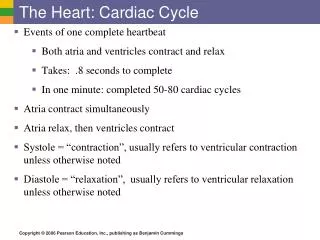
The Heart: Cardiac Cycle. Events of one complete heartbeat Both atria and ventricles contract and relax Takes: .8 seconds to complete In one minute: completed 50-80 cardiac cycles Atria contract simultaneously Atria relax, then ventricles contract

E N D
The Heart: Cardiac Cycle • Events of one complete heartbeat • Both atria and ventricles contract and relax • Takes: .8 seconds to complete • In one minute: completed 50-80 cardiac cycles • Atria contract simultaneously • Atria relax, then ventricles contract • Systole = “contraction”, usually refers to ventricular contraction unless otherwise noted • Diastole = “relaxation”, usually refers to ventricular relaxation unless otherwise noted
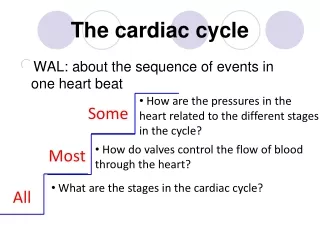
The Heart: Cardiac Cycle • 3 Events of the Cardiac Cycle • Mid-to-late diastole – blood flows into ventricles, as atria contract • Ventricular systole – blood pressure builds before ventricles contract, pushing out blood from the heart • Early diastole – atria finish re-filling, ventricular pressure is low
Filling of Heart Chambers – the Cardiac Cycle Figure 11.6
ECG, EKG (Electrocardiogram) • Measure and records the electrical activity (current flow) of the heart 3 Recognizable waves • P wave: Small, depolarization of the atria (atria contracting) • QRS wave:Depolarization of the ventricle (ventricles contracting) • T wave: “Ventricular repolarization”- represents electrical activity when ventricles are recharging for next electrical activity • Myocardial infarct (heart attack): area of heart tissue where cardiac cells have died, generally due to ischemia(loss of blood flow 2 heart) • Normal wave pattern is lost
Lub dup! • Sounds heard during the cardiac cycle • Lub- 1st heart sound • Occurs at beginning of ventricular systole • Sound of the closing of the AV valves • Dup-2nd heart sound • Occurs at end of systole • Sound of the closing of semilunar valves • Abnormal Heart Sound: Heart murmur
Cardiac Output Regulation Figure 11.7
The Heart: Cardiac Output • Cardiac output (CO) • Amount of blood pumped by each side of the heart (ventricle) in one minute • CO = (heart rate [HR]) x (stroke volume [SV]) • Calculate CO if HR=75 beats/min, SV=70 ml/beat • 5250 ml/min • Stroke volume • Volume of blood pumped by each ventricle in one beat/contractions • The stronger the contraction, the greater the stroke volume which increases cardiac output.
The Heart: Regulation of Heart Rate Starling’s law of the heart – the more the cardiac muscle is stretched, the stronger the contraction The cardiac muscle is stretched with increased venous return to the heart. Exercise increases the venous return (amount of blood entering heart from veins) Increase venous return—increases SV and CO
The Heart: Regulation of Heart Rate Increased heart rate increases cardiac output Factors that increase heart rate Sympathetic nervous system Hormones, epinephrine and thyroxine Exercise Increased venous return Sudden Decrease in blood volume (hemorrhage) Fever
The Heart: Regulation of Heart Rate Factors that decrease heart rate Parasympathetic nervous system (High blood pressure or blood volume inhibits sympathetic system) low venous return Cold temperatures
Abnormal Heart Rate • Normal Heart Rate: 60-100 beats per minute • Tachycardia: rapid heart rate (>100bpm) • Can lead to fibrillation (rapid shuddering of heart) • Bradycardia: slower than normal heart rate (<60 bpm) • Arrhythmia: irregular heart rate
Pulse Pulse – expansion and recoil of a blood vessel wall (pressure wave) occurs as heart beats Monitored at “pressure points” where pulse is easily palpated Figure 11.16
Blood Pressure Measurement of force applied to artery walls Measurements made on the pressure in large arteries (brachial arteries) B.P. reading given as 2 numbers: 120/80 mmHg Higher on artery side, decreases as you move away from the heart
Blood Pressure Systolic – pressure at the peak of ventricular contraction (top #) Example: on cuff below, the systolic is 118 Diastolic – pressure when ventricles relax (bottom #) Example: on cuff below, the diastolic is 78
Blood Vessels: The Vascular System Pathway of blood flow in vascular system (see below) Arteries arterioles capillaries venules veins Largest-->>smallest---------------->>smallest>>largest Figure 11.8a
Differences Between Blood Vessel Types • Walls of arteries are the thickest • Must be able to expand when blood is forced into it/compress as blood is forced out into circulation • Lumens of veins are larger • Lower pressure, moving blood against gravity • Vein Special Features: • Skeletal muscle contracts, pressing against the veins. Valves proximal to area of contraction are open, squeezing blood toward the heart. • Walls of capillaries are only one cell layer thick to allow for exchanges between blood and tissue
Movement of Blood Through Vessels Figure 11.9
Peripheral Resistance and Blood Pressure Amount of friction encountered by blood as it flows through the vessels Atherosclerosis Changes in walls of arteries due to lipid deposits Arteries lose elasticity Pictured Left: Coronary artery arteriosclerosis