Download
1 / 23
230 likes | 356 Vues
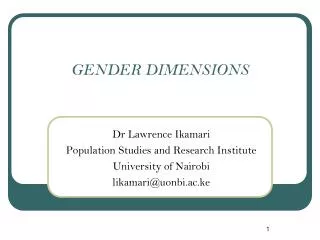
Extent and Dimensions of Gender Bias in India. Premananda Bharati, Manoranjan Pal and Bholanath Ghosh Indian Statistical Institute 203 BT Road, Kolkata 700108. Introduction.

E N D
Extent and Dimensions of Gender Bias in India Premananda Bharati, Manoranjan Pal and Bholanath Ghosh Indian Statistical Institute 203 BT Road, Kolkata 700108
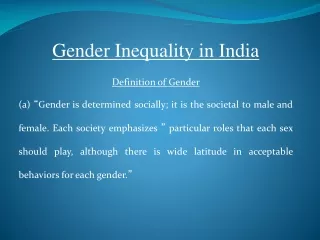
Introduction • Gender disparity refers to inequality between male and female through social, biological or psychological aspects of life. • The Middle East, North Africa, East Asia and South Asia are having the largest gender differences. • Discrimination against specific gender depends on individual or household based factors depending on many hidden or underlying factors. It directly or indirectly has effects on malnutrition, morbidity and even mortality in the society.
Kinds of Gender Bias Considered Here Female infanticide Education Unequal childhood care Gender Bias Disproportionate share of child malnutrition Intra-household food distribution
Objectives India is a cosmopolitan vast country, so it has a great diversity in every aspects of life. It is not possible to cover gender discrimination in every aspects of life. The main objectives are to see the gender bias through child health in respect of mortality, morbidity, immunization taken, nutritional status and feeding practices.
Methodology • Descriptive Measures from recent national level data (NSS, Census, NFHS etc. ) • -- Special Emphasis Given: weight-for-age, height-for-age, and weight-for-height. • Cut off point: Two standard deviations below the reference population (international reference population as recommended by the World Health Organization). • Children below the cut off point for • Weight for Age: Underweight • Height for Age: Stunting (Chronic under nutrition) • Weight for Height: Wasting (too thin)
Sex Ratio of India (2001 – 2011) Census and its change Source: Census, New Delhi, 2011.
Gender Bias- Sex Ratio • Total • 0-6 Years
Infant Mortality Rates by Sex, 2005 Source: Registrar General, India, SRS Bulletin, Oct., 2006, New Delhi, Oct. 2006.
Under Five Death Rates by Sex and Residence, 2002 Source: Registrar General, India, Sample Registration System, Statistical Report 2002, New Delhi 2004.
Percentage distribution of health care taken during morbidity of under-five children in India by gender
Percentage distribution of immunization status of (12-23 months) children in India by gender
Gender disparity in health care and feeding practices in India, 1998-99 Source: IIPS & ORC MACRO, National Family Health Survey, 1998-99. PRCs and IIPS, Bombay, National Family Health Survey, 1992-93, and State level reports. Notes: nc – not computed because of small sample size. Reference period for fever and diarrhoea is two weeks prior to the survey. * 0 to 4 age group. HCDI = [all vaccine (F–M)+breastfeeding (F–M)]/2, Gender gap in health care = (all vaccine |F–M|+breastfeeding |F–M|)/2.
Disparity in nutritional status of children, 1998-99 Sources: IIPS & ORC MACRO, National Family Health Survey, 1998-99. PRCs and IIPS, Bombay, National Family Health Survey, 1992-93, State level reports, 1994 and 1995. * Age group 0 to 4 years. NDI = [underweight (M – F) + stunted (M – F) + wasted (M – F)] / 3 Gap in nutritional status = (underweight |M – F| + stunted |M – F| + wasted |M – F|) / 3
Boys WEIGHT FOR AGE % Underweight < Median – 2 SD Median – 3 SD to Median – 2 SD Median – 2 SD < Median – 3 SD Girls % Median – 3 SD to Median – 2 SD < Median – 3 SD Median – 2 SD < Median – 2 SD
Boys % HEIGHT FOR AGE Stunting < Median – 3 SD Median – 3 SD to Median – 2 SD Median– 2 SD < Median – 2 SD Girls % Median – 3 SD to Median – 2 SD < Median – 3 SD Median– 2 SD < Median – 2 SD
Boys % WEIGHT FOR HEIGHT Wasting Median – 3 SD to Median – 2 SD Median – 2 SD < Median – 3 SD < Median – 2 SD Girls % Median – 3 SD to Median – 2 SD Median – 2 SD < Median – 3 SD < Median – 2 SD
Intra-household Food Distribution Gender differences are also commonly seen in case of intra-household food distribution in different caste groups, but not in the tribal communities. Study on food distribution among tribal populations in India did not show gender inequality in food distribution at household level while it exists among the caste communities. The study also shows that religion, occupation and rural or urban factors are not related to gender differences in food distribution in the family..
Conclusion • This study reveals that between 1992-93 and 1998-99, India experienced a positive change in social development and levels of living. • However, there exists a substantial difference in the developmental opportunities of male and female children. • Disparity exists in different practices related to childcare as well as opportunities for educational attainment. • Though there is a little decrease in health care disparity and educational disparity, mortality and nutritional disparities have increased slightly in the country.
Conclusion • Gender disparity exists in varying degrees in all the states and is noticeably high in the larger states of Bihar, Uttar Pradesh, Orissa, and Rajasthan. • Increasing social development may help in reducing gender disparity in nutritional status of children. • Although educational disparity is moderately related to social development, level of living and female autonomy, it can be eliminated by government policies towards child education and rigorous implementation of these policies.