The Evolution of Mass Spectrometry: Pioneers and Techniques in Isotope Discovery
This lecture outlines the pivotal history of mass spectrometry, starting with J.J. Thompson's separation of neon isotopes in 1913, which provided the first evidence of stable isotopes and earned him the 1906 Nobel Prize in Physics. F.W. Aston's contributions in the 1922 Nobel Prize for Chemistry through isotopic discoveries and the mass spectrograph are discussed. The establishment of quadrupole mass spectrometry in 1953 and further developments by Tanaka and Fenn in the 2002 Nobel-winning electrospray and soft laser desorption techniques are highlighted. Key aspects of Electron Impact Mass Spectrometry and fragmentation are explored, along with how mass spectra provide vital molecular and structural information.

The Evolution of Mass Spectrometry: Pioneers and Techniques in Isotope Discovery
E N D
Presentation Transcript
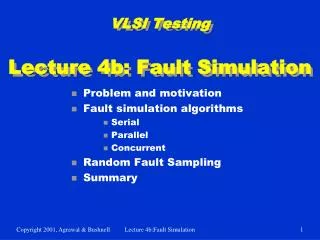
Lecture 4b Mass Spectrometry
History • J. J. Thompson was able to separate two neon isotopes (Ne-20 and Ne-22) in 1913, which was the first evidence that isotopes exist for stable elements (Noble Prize 1906 in Physics, Discovery of the electron in 1897) • F. W. Aston, who received the Noble Prize in Chemistry in 1922, discovered isotopes in a large number of nonradioactive elements by means of his mass spectrograph (first one build). He also enunciated the whole-number rule, which states that the masses of the isotopes are whole number multiples of the mass of the hydrogen atom • H. Dehmelt and W. Paul built the first quadrupole mass spectrometer in 1953 (Noble Prize 1989 in Physics) • K. Tanaka and J.B. Fenndeveloped the electrospray and soft laser desorption method, which are used for a lot of proteins (Noble Prize 2002 in Chemistry)
Electron Impact Mass Spectrometry I • Electron Impact (EI) is hard ionization technique • An ionizing beam of electrons generated in the ionization chamber causes the ionization and/or fragmentation of the molecule • The higher the energy of the electrons is, the more fragmentation is observed up to the point where the molecular ion (M+) cannot be observed anymore From GC AB AB AB+ B+ AB+ A+ B+ AB+ A+ B+ AB+ AB+ AB+
Electron Impact Mass Spectrometry II • Mass spectrometers are often connected to gas chromatographs (GC/MS) to separate the compounds before they enter the mass spectrometer • They only require very small amounts of sample (~1 ng) • The mass spectrometer employs an ultrahigh vacuum (<10-6 torr) • Since there is only one detector, the magnetic field has to be scanned during the acquisition in order to collect ions with different m/z ratio, which arrive at different times • The neutral fragments do not interact with the magnetic field and are lost in the process (bounce into the walls)
Fragmentation I • The mass spectrum is a plot of the relative ion abundance versusm/z(mass/charge, the charge is usually z=+1) • Themolecular ion peak(=parent peak) is the peak that is due to the cation of the complete molecule • Thebase peakis the largest peak in the spectrum (=100 %) • Stevenson’s rule: When a fragmentation takes place, the positive charge remains on the fragment with the lowest ionization energy • The more stable the fragment is, the higher the abundance of the ion is resulting in a larger peak because its lifetime is longer
Information from the Mass spectrum I • Molecular Mass • Presence of an odd number of nitrogen atoms (if molecular mass is odd) • Presence of certain fragments that are due to very strong peaks i.e., benzyl, acylium, etc. • Presence of certain functional groups due to fragments lost or observed i.e., alcohols exhibit a peak at m/z=31 due to [CH2OH]-fragment while at m/z=47 due to [CH2SH]-fragment
Information from the Mass spectrum II • Structural information about the molecule can be obtained by analysis of lost fragments and the identification of stable ions in the mass spectrum
Information from the Mass spectrum III • Number of carbon atoms from the ratio of [M+1]/[M]-peaks (1.1% for each carbon) i.e., the ratio would be 11% (=0.11) if there were ten carbon atoms in the fragment • The Mc Lafferty rearrangement is observed for carbonyl compounds witha longer chain
Information from the Mass spectrum IV • If several chlorine and/or bromine atoms are present in the molecule, isotope clusters consisting of (n+1) peaks are found in the spectrum • Pattern for halogen clusters
Caffeine Mass Spectrum (EI) • The mass spectrum of caffeine displays peaks are m/z=194 (100), 109 (40), 82 (14), 67 (17) and 55 (17).