Download

1 / 24
240 likes | 443 Vues
Power Reduction Strategies in Super Scalar Processors. CS 752 Final Project Presentation Harish Krishnan Radhakrishnan Iyer. Why Pipeline Gating ?. Increased IPC achieved is at the cost of wasted work. Branch mis-speculation is power hungry! Power Reduction Techniques:-

E N D
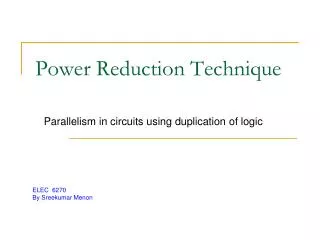
Power Reduction Strategies in Super Scalar Processors CS 752 Final Project Presentation Harish Krishnan Radhakrishnan Iyer
Why Pipeline Gating ? • Increased IPC achieved is at the cost of wasted work. • Branch mis-speculation is power hungry! • Power Reduction Techniques:- Power Vs Performance – Optimal Solution • Thus the need to control rampant speculation without unduly affecting performance. • Thus the idea is to estimate the confidence of the branch prediction before performing the instructions in the speculated path. [Mane, Klauser, et.al]
Confidence Estimation & Pipeline Gating taken/ not-taken Confidence Estimation techniques have been used in a variety of methods including branch prediction, SMT etc Execution pipelines Instruction Fetch Branch predictor Low/high confidence Confidence mechanism Top level interaction of the different modules • Confidence Estimation Metrics: • SPEC (specificity) - represents the fraction of incorrect predictions • identified as low confidence . • PvN (predictive value of negative test) -probability that our • low confidence estimation is correct.
Various Confidence Estimation Techniques • Static Schemes – Associates a confidence estimate for each conditional branch. Determined by running the program through a branch prediction simulator and assigning low confidence or high confidence to each branch depending on a specified threshold value. • Advantage • One can set the SPEC and PvN • Disadvantage • Need for separate profiling step • Highly optimistic scheme because it implies “perfect profiling” • Not suitable for varying applications as the low/confidence estimated is entirely dependent on the data set used for profiling • Poor performance as compared to dynamic schemes
Dynamic Confidence EstimationPower – Performance Analysis • Method – 1 – Saturating Counter values of Branch Predictor as confidence estimator [Smith]. Baseline values - * - gcc
Performance Analysis of Method 1 • The reasons for the ‘poor performance’ are the • Poor values of the metrics. • Stalling fetch for every low confidence branch decreases the IPC considerably decreasing power improvement. CONCLUSION! – Use better confidence estimators. Control the frequency of stalls.
Dynamic Confidence EstimationPower – Performance Analysis • Method 2:- Try to prevent frequent stalls - Pipeline ‘Gate’ or stall fetch taking into consideration a threshold value ‘N’. • We varied the thresholds for both the previously considered underlying branch predictors to find the optimal value of threshold If lowconf branch resolved lowf_con-- M = counter value M >N counter stall low_conf++ Fetch Decode Issue Write back Commit Pipeline Gating with Threshold
Dynamic Confidence EstimationPower – Performance Analysis • Results GShare Bimodal * Gshare Values
Comparison of Method 1 Vs Method 2 *- for bimodal branch predictor Notice the ‘boost’ !
Dynamic Confidence EstimationPower – Performance Analysis High/low confidence signal 2^m • Method 3 – One Level Confidence Estimation [Smith] • Parameters changed for finding optimal performance were: • Table size (CT) – 2^16 Vs 2^14 • Reduction Function - 1’s counting • Threshold value - 3 BranchPC + BHR Reduction Function m bits n bit CIR
Dynamic Confidence EstimationPower – Performance Analysis Results: Impact of CT Table on performance:
Dynamic Confidence EstimationPower – Performance Analysis FINAL RESULTS !
Pipeline Balancing: Idea ? • Fact 1:Different programs have different Resource Requirements. • Fact 2: Within a program there are varying Issue needs. • TAKE ADVANTAGE TO SAVE ON POWER.`
FACT 1: Programs have different Resource Requirements! TRUE? • Ran Tests on GCC,PERL and JPEG to identify “perfect resource requirements”
Fact 1: Programs have different Resource Requirements! TRUE? Contd.
Fact 2: Within an Application Is there a Variance? • Measured the Issue ipc for every window period of 10K cycles.
How do we take advantage of this Variance? Pipeline Balancing • Pipeline Balancing “Past Behavior Predicts Future”. • Monitor Iipc and compare it with threshold values to decide whether to change current Issue width.
How did we pick the Threshold Values? Predicted ModePL PN RLRN Resulting Mode • Aim: Maximize Hits on LL and NN while still being able to recognize changing program behavior.
Our Claims and Results • Claim 1:The finer the granularity within which we can provide the dynamic re-configuration the greater the power savings we should achieve. • Claim 2: Mispredictions which hurt power are better than mispredictions that hurt performance. • Claim 3: Pipeline Balancing produces sure improvements in Energy*Delay product over all programs.
Claim 1: Finer Granularity! Notice! The lesser the window period the greater benefit in Energy*Delay product.
Threshold => Above what value of Iipc should I switch to issue width 4 from issue width 2 Claim 2: Mispredictions! Notice! For having a small threshold value we sacrifice on power and having a large threshold on performance. Lower Threshold always perform better than their larger counterparts.
Conclusion • There are sure gains that can be achieved using Pipeline Gating and Balancing and are good architectural solutions to build Power Efficient Processors! Questions?
Sim- Wattch Simulator • Sim Wattch – Fast , usefully accurate, high level power simulator. Based off Simple-Scalar. Power Estimation: • Define power models for basic hardware structures. • On startup power model accessed to generate a power estimate for various processor units. • The Power estimates are the scaled dynamically with access counts and activity factor. • Features: • Allows for high level design modification considering power requirements • Keeps track of access to each resource dynamically • Parameterizable Model • Clock gating styles