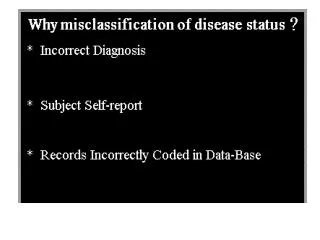
Why Misclassification of Exposure Status?
370 likes | 603 Vues
Why Misclassification of Exposure Status?. Imprecise measurement Poorly constructed questionnaire Faulty measuring device Uncertainties and errors in the exposure database Subject’s self-report of exposure Recall bias

Why Misclassification of Exposure Status?
E N D
Presentation Transcript
Why Misclassification of Exposure Status? Imprecise measurement Poorly constructed questionnaire Faulty measuring device Uncertainties and errors in the exposure database Subject’s self-report of exposure Recall bias Controls less motivated than cases to report exposures in case-control studies Interviewer bias Probe exposure status among cases more thoroughly than for controls
Non-differential Misclassification of Disease: • Misclassification of disease status is not related to exposure status • Sensitivity of disease classification is the same for exposed and unexposed subjects • Specificity of disease classification is the same for exposed and unexposed subjects
Hypothetical scenario showing effect of non-differential disease misclassification bias on measures of association
Effects of non-differential disease misclassification • In cohort studies, if the specificity of classification is equal to 1.0, then the relative risk (or risk ratio) will not be biased towards the null, but the risk difference will be biased towards the null. • Reduction in specificity produces a greater bias towards the null than reduction in sensitivity, especially for relatively rare diseases.
Non-differential Misclassification of Exposure: • Misclassification of exposure status is not related to disease status • Sensitivity of exposure classification is the same for diseased and non-diseased subjects • Specificity of exposure classification is the same for diseased and non-diseased subjects
Study of Occupational Exposure Misclassification by Expert Assessment:agents with low to high misclassification
Study of Occupational Exposure Misclassification by Expert Assessment • True odds ratio = 2.0
Study of Occupational Exposure Misclassification by Expert Assessment • True odds ratio = 4.0
Study of Occupational Exposure Misclassification by Expert Assessment • Expert assessors were compared to an expert reference rater who may also have misclassified exposures • The attenuation of the odds ratio was considerable even for exposures classified with high sensitivity and high specificity • The extent of misclassification bias is dependent upon: • the exposures being assessed • low specificity and sensitivity occurred for very specific exposures and exposures that were difficult to infer from the job task • prevalence of exposure
Hypothetical scenario showing effect of non-differential exposure misclassification bias on measures of association True Observed (Se=1.0, Sp=1.0)(Se=.80, Sp=1.0) (Se=1.0, Sp=.96) _ _ _ E E E E E E D 10 50 D 8 52 D 12 48 _ _ _ D 990 9,950 D 792 10,148 D 1,388 9,552 RR = 2.0 RR = 1.96 RR = 1.71 RD = .005 RD = .0049 RD = .0036
Hypothetical scenario showing effect of non-differential exposure misclassification bias on measures of association(from previous example)True RR = 2.0 True RD = .005
Hypothetical scenario showing effect of non-differential exposure misclassification bias on measures of association:summary When disease is rare, misclassifying truly unexposed workers as being exposed (↓ specificity) has a greater impact (bias to the null) than misclassifying truly exposed workers as being unexposed (↓ sensitivity).
Effect of non-differential exposure misclassification:true RR = 2.0 in a case-control study
Effect of non-differential exposure misclassification • The extent of the bias towards the null is dependent on • Sensitivity of exposure classification • Specificity of exposure classification • Proportion of the truly exposed in the population (controls).
Differential Misclassification of Exposure • Misclassification of exposure status is related to disease status • e.g. recall bias • Disease subjects (or cases) are more motivated to recall exposures than non-disease subjects (or controls) • Can occur when categorizing a continuous exposure variable using pre-defined cutpoints that are either too wide or do not differentiate homogeneous risk groups
Categorization of a continuous exposure measurement and differential exposure misclassification bias • Type of error in the continuous measurement: • Purely random exposure measurement error • Bias to the null regardless of cutpoints used • Systematic error in the exposure measurement • Can lead to differential bias depending on the cutpoints used • The exposure misclassification can be related to disease status because the probability of exposure misclassification is higher near the cutpoint and the risk of disease near the cutpoint can be different from the risk of disease further from the cutpoint. • Can be minimized by using quantiles, but use of quantiles can produce unacceptable bias to the null. Best approach is to use narrow cutpoints and/or cutpoints that define homogeneous risk groups.
Minimizing Differential Exposure Misclassification Due to Recall Bias • Responses to open-ended questions are more likely to be subject to recall bias • Characteristics associated with improved self-reporting: • Asking about agents that are easily sensed • solvents and other chemicals that smell • dusts with large particle sizes • vibrations that can be felt • Using terms the workers recognize (e.g., degreasers) rather than the names of specific agents • Asking about job tasks and processes rather than specific agents • Probing with a list of agents in a structured fashion
Minimizing Differential Exposure Misclassification Due to Recall Bias • Use more “objective” sources of information on exposure: • Area/personal monitoring data • Environmental sample data + modeling • Expert assessment of exposures by industrial hygienists • Job-exposure matrix • Workplace databases • Environmental databases
Example of possible differential misclassification of disease Study of cancer incidence among triazine herbicide manufacturing workers, Journal of Occupational and Environmental Medicine, November 2002. • Cancer incidence of worker cohort compared to local population cancer rates, 1985-1997 • 1,861 men, 19,264 person-years • Prostate cancer SIR: 175 (11/6.3) 95% confidence interval = 87, 312
Triazine Herbicide study Conclusion (quoted from the paper): • Of the 11 prostate cancer cases, nine were diagnosed at an early clinical stage. • From 1993 to 1999, the proportion of male company employees who had at least one PSA test was 86% for those who reached 40 years of age while actively working and was 98% for those who reached 45 years of age. • The observed prostate cancer increase may have been due to the frequent PSA testing of actively working company employees. There is no epidemiologic or other information that clearly supports a causal relation between atrazine and prostate cancer.
Triazine Herbicide study: further considerations Was the excess in prostate cancer incidence due to a PSA screening program in the workplace that did not exist in the comparison (local) population? This is a matter of dispute “Prostate cancer was of particular interest because an earlier investigation (unpublished) of cancer incidence during 1985–1993 among workers at the plant found five observed compared to 2.0 expected cases of this disease.” The excess during 1985-1993 occurred prior to the introduction of the extensive PSA screening program!