Download

1 / 16
160 likes | 239 Vues
Explore the importance of improving sub-national disability prevalence estimates, delve into concepts of disability, data sources, methods of analysis, utilizing Empirical Bayes techniques, and conclude with the benefits of accurate regional data.

E N D
Improving sub national estimates of disability prevalence Alan Marshall Manchester University
Presentation Structure • Why do we need to improve estimates? • Concepts of disability and data issues. • HSE 2001 – Locomotor disability prevalence. • Preliminary Analysis. • Empirical Bayes techniques. • Conclusions.
Why do we need to improve sub national estimates? • Census data lacks detail • Survey data lacks geography. • Survey estimates become increasingly unreliable at sub national level. • Data on disability prevalence (by type and severity) are important for planning of service provision.
Disability – Concepts and Definitions? • Medical Model – Locates the source of disability in the individual’s deficiency and his or her personal incapacities. • Social Model - Disability is a form of oppression caused by the aspects of society that prevent people with physical impairment from participating in everyday activities. (Abberley in Levitas, 1996)
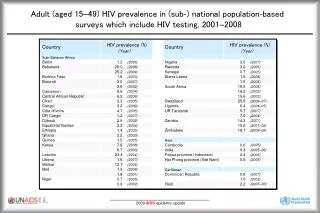
Disability: official data sources • Census, • General Household Survey, • Health Survey for England • OPCS disability surveys 1969, 1984 and 1996/7 Disjointed approach to data collection (Abberely in Levitas, 1996). Estimates vary between sources because surveys are not consistent in their definitions used or population sampled. No true disability prevalence figure, depends on definitions used and motives of collector.
HSE 2001 HSE gives most recent source of detailed data on disability. 5 disability types are measured: Locomotor disability is assessed according to ability to: • Walk 200m without stopping and without discomfort. • Walk up and down stairs. • Pick up objects from floor. Note: - this relates to performance without aids – e.g. walking stick. (Bajekal et al, 2002)
Analysis – HSE 2001 • Evidence of a strong relationship between age and disability prevalence. • Age specific disability schedule similar between areas (and by type). • May be regional differences in the level of disability prevalence. • These findings are important considerations when deciding how to improve the precision of estimates.
Empirical Bayes (EB) Techniques EB techniques have been shown to improve estimates where rates have strong spatial and age patterns (Assuncao et al, 2005). Use Bayes theorem to adjust our expectations of the GOR rate based on knowledge of the national rate. Assume the National schedule gives ‘true’ (or most reliable) estimates of the Parameters. The GOR schedules are variations on this national schedule.
Empirical Bayes (EB) Techniques Variance of the GOR rates are composed of: • The variance of the parameter estimates in England. • The sampling variance in each GOR region (ie the variance in the GOR rate given that we know the England rate). Shrink GOR estimates towards National estimates; If the majority of variation is due to sub national sampling then the estimate is moved further towards the national rate.
Evaluation of EB techniques • HSE 2000 includes data on disability. • Combine 2000 and 2001 data. • Compare new estimates to EB estimates. • Use EB on combined data. • Expect: • EB on 2001 data to move estimates toward combined estimates. • EB on combined estimates to have less effect.
Conclusions • There is a lack of detailed data on disability at sub-national levels. • No true figure for disability prevalence as definitions of disability are contested. • Disability is strongly related to age, there is evidence higher/lower rates in some GOR regions. • Empirical Bayes techniques enable shrinkage of GOR estimates to more reliable national rates. • Comparison of EB adjusted prevalence rates and data from the 2000 and 2001 HSE allows an evaluation of the success of EB techniques.
Less precise for older ages Shape similar to mortality curve
NE curve above England curve
SE curve below England
Large sampling Variance – more shrinkage Smaller sampling variance Less shrinkage