Measuring Disability Prevalence
Measuring Disability Prevalence. Daniel Mont, HDNSP Disability and Development Team June 6, 2007. World Bank and Disability – What is the link?. The World Bank’s mission is to eliminate poverty Disability leads to poverty, and poverty leads to disability

Measuring Disability Prevalence
E N D
Presentation Transcript
Measuring Disability Prevalence Daniel Mont, HDNSP Disability and Development Team June 6, 2007
World Bank and Disability – What is the link? • The World Bank’s mission is to eliminate poverty • Disability leads to poverty, and poverty leads to disability • Disability affects not just disabled people, but their families and communities • Doing a good job on poverty alleviation requires taking disabled people into account
Problems with existing data • Often not available • Definitions and measures not standard and often outdated • Quality is poor
Medical Model vs. Social Model • Medical model – Disability is a physical, mental or psychological health condition that limits a person’s activities • Social model – Disability arises from the interaction of a person’s functional status with the environment
Medical versus Social Model • PERSONAL vs. SOCIAL • Medical care vs. Social integration • Individual treatment vs. Social action • Professional help vs. Individual and collective responsibility • Personal adjustment vs. Environmental adjustment • Behavior vs. Attitude • Care vs. Human rights • Individual adaptation vs. Social change
WHO’s International Classification of Functioning, Disability and Health (ICF) • Incorporates social model approach • Describes facets of human functioning that may be affected by a health condition • Purpose: • provide a scientific basis for the consequences of health conditions • establish a common language to improve communications • permit comparisons of data across countries and health care disciplines, • provide a systematic coding scheme for health information systems
ICF Domains – Body Function and Structure • Physiological and psychological function of body systems • Very specific recording of detailed functional abilities and impairments • Not linked to cause. For example, fluency and rhythm of speech functions – could be from stuttering, stroke, or autism
Activities and Participation • Describes individual’s functioning as a whole person • Range from Basic to Complex • Basic: e.g., walking, eating, and bathing • Complex: e.g., work and schooling • Activities – tasks an individual can do that require multiple body functions • Participation – higher order activities that involve integration in the community
ICF is a Functionally Based System • ICF does not measure disability • It describes people’s functional abilities in various domains • Health conditions that affect functional status are not part of classification system • Disability is not an “all or nothing” concept • Disability arises out of the environmental context
Body function&structure(Impairment) Activities (Limitation) Participation (Restriction) Environmental Factors Personal Factors International Classification of Functioning, Disability and Health (ICF) Health Condition (disorder/disease)
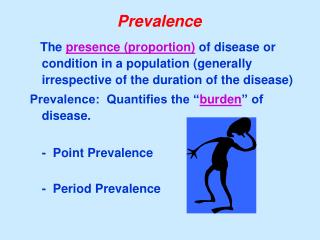
How can we capture such a complex concept of disability in a single measure?
Why not ask this old question? • Do you have a physical, mental, or emotional health condition that limits the amount or type of work you can do?
Because… • In some sense, the answer for everyone is “YES” • The answer is a function of the environment the respondents live in • Physical environment • Cultural environment • Policy environment • The answer is a function of their particular circumstances at the time • The question is very complex and easily misinterpreted
Why not ask this question? • Do you have a disability?
Under counts what most people consider disability • People think of disability as very serious and won’t report minor or moderate disabilities • “Disability” creates shame and stigma so people do not want to identify themselves that way, especially for mental and psychological • People think of disability relative to their expectations of normal functioning so it undercounts the elderly
Why not ask detailed diagnosis questions? • Many people don’t have or don’t know their diagnosis • Some diagnoses have intense stigma • A diagnosis doesn’t tell you much about ability to function • Can miss age related disabilities • If people have multiple diagnoses they’ll often report only one • The one with less stigma • The one that occurred first • The one that’s most visible • Ability and willingness to report often depends on their interaction with health services and thus other socio-demographic factors
Body function&structure(Impairment) Activities (Limitation) Participation (Restriction) Environmental Factors Personal Factors Where we focus on this model depends on the purpose of measurement Health Condition (disorder/disease)
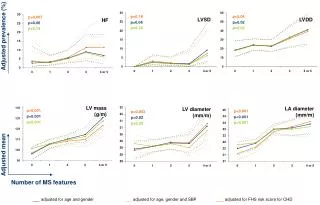
National prevalence rates • Internationally comparable • Capture broad spectrum of those with disabilities • Questions suitable for census • To examine the relationship between disability and socio-economic outcomes
Equalization of Opportunity • UN Washington Group concluded that Equalization of Opportunities was most appropriate for a census. • So ask participation questions? No. • That identifies the segment of the population that is not participating so can’t look at progress of inclusion • Not internationally comparable
Activity level questions indicate whether a person is having difficulty with important tasks • If these activity limitations are correlated with outcome measures (e.g., poverty) this indicates there are important barriers to participation
WG Questions • Because of a physical, mental or emotional health condition… • Do you have difficulty seeing, even if wearing glasses? • Do you have difficulty hearing, even if wearing hearing aid/s? • Do you have difficulty walking or climbing stairs? • Do you have difficulty remembering or concentrating • Do you have difficulty with self-care, such as washing all over or dressing? • Do you have difficulty communicating (for example, understanding or being understood by others)? • Response categories: No, Some, A lot, Unable
Cognitive Testing • To examine interpretation of questions • Conducted in about 15 countries • Performed very well • Issues: • Difficulty with glasses and hearing aid/s clause • Communication question
Field Testing • Vietnam and South Africa • UNESCAP testing in Philippines, Fiji, India, Indonesia and Mongolia • Again, responses fairly robust
Responses • Scaled responses • No, Some, A lot, and Unable • Allows user to shift threshold as desired • Captures heterogeneity of disability
Recommendations for General Prevalence Measures • Questions should be based on functionality • Questions should focus on core activities • Equalization of opportunity • International comparability • Do not use the word “disability” • Responses should be scaled • A range of prevalence should be reported for various levels of severity, rather than a single prevalence rate
Disability Prevalence • Ecuador 12.1% • Nicaragua 10.3% • Brazil 14.5% • Zambia 13.1% • Vietnam 10.5% (preliminary) • India 8% • Roughly, 10-12% is reasonable estimate with less than half “severe” and about 1-2% incapable of self-care