Download
1 / 42
420 likes | 580 Vues
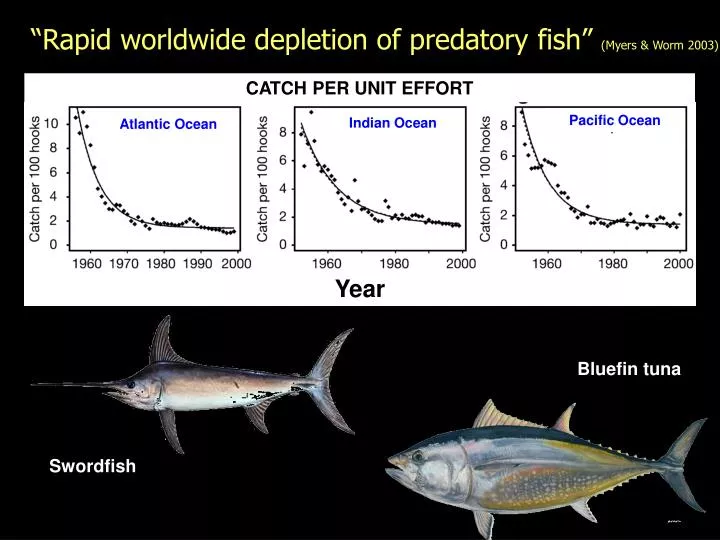
“Rapid worldwide depletion of predatory fish” (Myers & Worm 2003). CATCH PER UNIT EFFORT. Pacific Ocean. Indian Ocean. Atlantic Ocean. Year. Bluefin tuna. Swordfish. What would happen to the value of the world’s pelagic fisheries if we closed the high seas?

E N D
“Rapid worldwide depletion of predatory fish” (Myers & Worm 2003) CATCH PER UNIT EFFORT Pacific Ocean Indian Ocean Atlantic Ocean Year Bluefin tuna Swordfish
What would happen to the value of the world’s pelagic fisheries if we closed the high seas? • How would changing the size of the EEZs change the outcome? • Is there an optimal EEZ size and high seas open/closed design that maximizes sustainable fishery value? • What are the conservation effects?
Mismatch between TURF size and scales of larval dispersal TURF TURF TURF Lost resource Lost resource
Mismatch between TURF size and scales of larval dispersal TURF TURF TURF • Solutions: • Make TURFs large (White and Costello 2010)
Mismatch between TURF size and scales of larval dispersal TURF TURF TURF $ $ $ $ • Solutions: • Make TURFs large (White and Costello 2010) • Share revenues or profits among TURFs (Cardin and White 2013)
Mismatch between TURF size and scales of larval dispersal Marine Reserve TURF TURF Resource returned • Solutions: • Make TURFs large (White and Costello 2010) • Share revenues or profits among TURFs (Cardin and White 2013) • Convert some TURFs to marine reserves (Costello and Kaffine 2009)
Mismatch between TURF size and scales of larval dispersal Marine Reserve TURF TURF TURF • Solutions: • Make TURFs large (White and Costello 2010) • Share revenues or profits among TURFs (Cardin and White 2013) • Convert some TURFs to marine reserves (Costello and Kaffine 2009) • Create trans-TURF MPAs (Toseland and Costello In Prep)
Exclusive Economic Zones International marine spatial property rights
Exclusive Economic Zones International marine spatial property rights One bluefin tuna in the year 2000 376 tuna in 2000-2009 Block et al. 2005 Block et al. 2011
Exclusive Economic Zones International marine spatial property rights One bluefin tuna in the year 2000 376 tuna in 2000-2009 Block et al. 2005 Block et al. 2011 = XEEZ
Exclusive Economic Zones International marine spatial property rights One bluefin tuna in the year 2000 376 tuna in 2000-2009 Block et al. 2005 Block et al. 2011 = XEEZ What would be the effects of changing XEEZ? What if the remaining high seas was a marine reserve?
MODEL I: Three-patch logistic model with fish stock dispersal 2 nations with identical EEZs 1 high seas Stock pool (complete mixing across all 3 patches) Near-exact analytical solutions determined for Nash equilibrium
MODEL II: Numerical evaluation of same model, but with: N>2 nations Different H,D,G process orders Profit (instead of yield) Nash found through fixed point iteration EEZ 1 EEZ 2 XEEZ HS EEZ n EEZ N
MODEL II: Numerical evaluation of same model, but with: N>2 nations Different H,D,G process orders Profit (instead of yield) Nash found through fixed point iteration EEZ 1 EEZ 2 XEEZ HS EEZ n EEZ N
MODEL II: Composite result Order: Harvest-Dispersal-Growth (same as analytical model) r=0.5, 1.0, 1.5, 2.0 N=50, 75, 100, 150
MODEL II: Composite result Order: Harvest-Dispersal-Growth (same as analytical model) r=0.5, 1.0, 1.5, 2.0 N=50, 75, 100, 150 What is expected gain over SQ from closing HS?
MODEL II: Composite result Order: Harvest-Dispersal-Growth (same as analytical model) r=0.5, 1.0, 1.5, 2.0 N=50, 75, 100, 150 What is expected gain over SQ from closing HS? 4-15x, increasing with # nations
MODEL II: Numerical evaluation of same model, but with: N>2 nations Different H,D,G process orders Nash found through fixed point iteration EEZ 1 EEZ 2 XEEZ HS EEZ n EEZ N
MODEL II: Composite result Order: Harvest-Dispersal-Growth (same as analytical model) r=0.5, 1.0, 1.5, 2.0 N=50, 75, 100, 150
MODEL II: Composite result Order: Harvest-Dispersal-Growth (same as analytical model) r=0.5, 1.0, 1.5, 2.0 N=50, 75, 100, 150 What is expected gain over SQ from closing HS?
MODEL II: Composite result Order: Harvest-Dispersal-Growth (same as analytical model) r=0.5, 1.0, 1.5, 2.0 N=50, 75, 100, 150 What is expected gain over SQ from closing HS? 2-5x, increasing with fish productivity
MODEL II: Composite result NOTE: MODEL II RESULTS ARE VERY LIKELY AN EXAGERATION OF EFFECTS BECAUSE OF THE STOCK POOL ACROSS THE ENTIRE DOMAIN ASSUMPTION
MODEL III: Global model Age-structured with larval dispersal and adult movement GIS-based spatial structure (in collaboration with Ben Best) Loosely based on Yellowfin tuna (Thunnus albacares)
MODEL III: Global model Age-structured with larval dispersal and adult movement GIS-based spatial structure (in collaboration with Ben Best) Loosely based on Yellowfin tuna (Thunnus albacares) Domain limited by latitudinal range boundarys: 50N-50S Fishbase: Model:
MODEL III: Global model Age-structured with larval dispersal and adult movement GIS-based spatial structure (in collaboration with Ben Best) Loosely based on Yellowfin tuna (Thunnus albacares) Domain limited by latitudinal range boundarys: 50N-50S Adult movement within ocean basins One bluefin tuna in the year 2000 Tracking studies: 376 tunas in 2000-2009 Block et al. 2005 Block et al. 2011 Model:
MODEL III: Global model Age-structured with larval dispersal and adult movement GIS-based spatial structure (in collaboration with Ben Best) Loosely based on Yellowfin tuna (Thunnus albacares) Domain limited by latitudinal range boundarys: 50N-50S Adult movement within ocean basins Larval dispersal within biogeochemical provinces Pelagic larval duration: 25 days (fishbase) mean displacement 10s-100s km (Siegel et al. 2003) Model:
MODEL III: Global model Age-structured with larval dispersal and adult movement GIS-based spatial structure (in collaboration with Ben Best) Loosely based on Yellowfin tuna (Thunnus albacares) Domain limited by latitudinal range boundarys: 50N-50S Adult movement within ocean basins Larval dispersal within biogeochemical provinces Local carrying capacity wrt Net Primary Productivity Oregon State University. 2007. Ocean Productivity - Net Primary Productivity, VGPM/SeaWIFS data. http://web.science.oregonstate.edu/ocean.productivity/onlineVgpmSWData.php (Accessed November 5, 2007)
MODEL III: Global model Buffer = 50 nm
MODEL III: Global model Buffer = 200 nm (Status quo)
MODEL III: Global model Buffer = 400 nm
MODEL III: Global model Buffer = 600 nm
MODEL III: Global model Buffer = 800 nm
MODEL III: Global model Buffer = 1000 nm
MODEL III: Global model Buffer = 1500 nm
Setting F in the global model Too complex to solve Nash Proxies based on Model II results:
MODEL II: Composite result Order: Harvest-Dispersal-Growth (same as analytical model) r=0.5, 1.0, 1.5, 2.0 N=50, 75, 100, 150 Setting F in the global model Too complex to solve Nash Proxies based on Model II results:
MODEL II: Composite result Order: Harvest-Dispersal-Growth (same as analytical model) r=0.5, 1.0, 1.5, 2.0 N=50, 75, 100, 150 Setting F in the global model Too complex to solve Nash Proxies based on Model II results: Status quo: ~2.5x overfishing in HS Close HS: ~4x increase in FEEZ
MODEL III: Global model. Preliminary results? Setting F in the global model Status quo: ~2.5x overfishing in HS Close HS: ~4x increase in FEEZ I DO NOT TRUST THESE RESULTS
MODEL III: Global model. Preliminary results? Setting F in the global model Status quo: ~2.5x overfishing in HS Close HS: ~4x increase in FEEZ I DO NOT TRUST THESE RESULTS