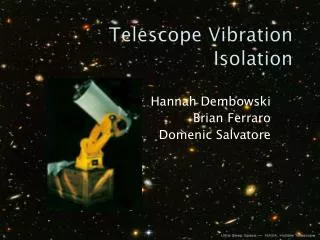
Telescope Vibration Isolation
Telescope Vibration Isolation. Hannah Dembowski Brian Ferraro Domenic Salvatore. The Problem. Vibrating at 150 microns (9 microns/pixel) Need to reduce to between 9 and 15 microns. 68-500 SERIES High-Capacity Lab Table. high load applications (over 350 lbs)

Telescope Vibration Isolation
E N D
Presentation Transcript
Telescope Vibration Isolation Hannah Dembowski Brian Ferraro Domenic Salvatore
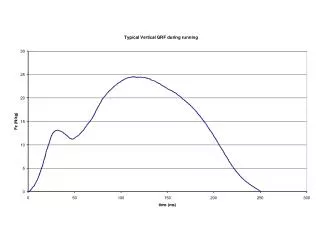
The Problem • Vibrating at 150 microns (9 microns/pixel) • Need to reduce to between 9 and 15 microns
68-500 SERIESHigh-Capacity Lab Table • high load applications (over 350 lbs) • unusually high centers of gravity and equipment with moving stages
Vibration Isolation for Telescope Mounts • mobile observatory applications • walking around telescope tripod or pier induces vibrations • Reduce vibrations if pier or tripod is bumped
65 SERIES Floor Platform with STACIS® • piezoelectric isolators • platform custom designed for footprint
Telescope Mount Design Options Design 1
Telescope Mount Design Options Design 2
Telescope Mount Design Options Design 3
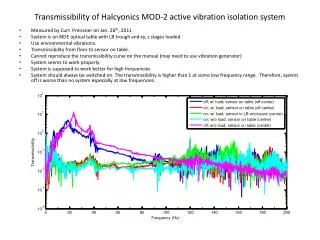
Design Comparison Input vibrations from PULSE data Predicted Final Vibrations after design implementation • Graphs show frequency, in Hz, on the x-axis • Graph on the left shows the input vibrations, in decibels, on the y-axis • Graph on the right shows each design’s final vibrations, in decibels, on the y-axis
Design Comparison Input vibrations from PULSE data Predicted Final Vibrations after design implementation • Graphs are zoomed in to show frequencies below 100 Hz • Shows a reduction of greater than 20 decibels at frequencies below 100 Hz
Future Steps • Refine SolidWorks models for more accurate moments of inertia • Take better low frequency measurements with different accelerometer • Amend possible mounting solutions • Concrete vs. iron/steel rods • Decide on and Implement solution • Get funding • Verify with building codes • Test solution • Measure final vibrations • New photos
References • http://www.pier-tech.com/vibration_isolation_telescope_mount.htm • http://www.techmfg.com/products/labtables/68500.htm • http://www.techmfg.com/products/floorplatforms/65seriesfloorplat.htm