Download
1 / 29
290 likes | 367 Vues
Montana’s Regionally Diverse Economy By Dr. Larry Swanson, O’Connor Center for the Rocky Mountain West, U. of MT

E N D
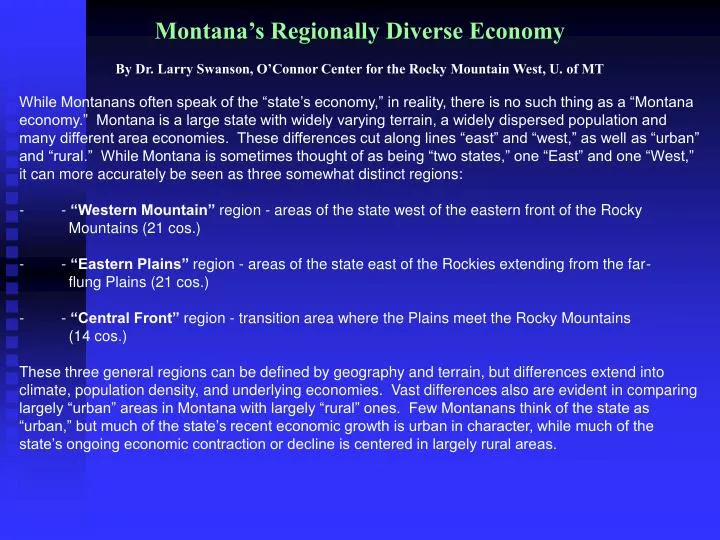
Montana’s Regionally Diverse Economy By Dr. Larry Swanson, O’Connor Center for the Rocky Mountain West, U. of MT While Montanans often speak of the “state’s economy,” in reality, there is no such thing as a “Montana economy.” Montana is a large state with widely varying terrain, a widely dispersed population and many different area economies. These differences cut along lines “east” and “west,” as well as “urban” and “rural.” While Montana is sometimes thought of as being “two states,” one “East” and one “West,” it can more accurately be seen as three somewhat distinct regions: - - “Western Mountain” region - areas of the state west of the eastern front of the Rocky Mountains (21 cos.) - - “Eastern Plains” region - areas of the state east of the Rockies extending from the far- flung Plains (21 cos.) - - “Central Front” region - transition area where the Plains meet the Rocky Mountains (14 cos.) These three general regions can be defined by geography and terrain, but differences extend into climate, population density, and underlying economies. Vast differences also are evident in comparing largely “urban” areas in Montana with largely “rural” ones. Few Montanans think of the state as “urban,” but much of the state’s recent economic growth is urban in character, while much of the state’s ongoing economic contraction or decline is centered in largely rural areas.
Patterns of Net Migration in Montana During the decade of the 1980s, 53,000 more people moved from Montana than the number moving to Montana, changing their permanent residence in the process. However, this pattern of out migration dramatically reversed itself during the decade of the 1990s with nearly 51,000 more people moving to the state than away between 1990 and 1999. While this migration shift is a dramatic reversal, not all areas of Montana are sharing evenly in this net migration. The chart on the upper right shows how net migration statewide during the last two decades is allocated by the three general regions. During the ‘80s all three regions experienced net out-migration. However, most population loss resulting from this was in Montana’s Central Front, with net out-migration of 24,847. and Eastern Plains, with net out-migration of 23,072. Out-migration from the West was relatively small at just over 5,000. In the ‘90s when the direction of net migration reversed, the Western Mountains saw most of the gain with net in-migration of 57,493. The chart below shows net migration during the 1990s by county, with individual counties in the West at the left and counties in the East at the right. The three counties with the highest net in-migration are Flathead (10,920), Ravalli (10,377), and Gallatin (9,534), all in the West. Yellowstone County had the 4th highest net in-migration (7,850), followed by Missoula (6,208), Lewis and Clark (4,308), and Lake (4,158). The county with the single highest net out-migration is Cascade (-5,411). Virtually all of the counties in the Eastern Plains region continue to see net out-migration.
Montana’s “Lop-sided” Population Growth Montana’s population grew by only 12,375 people in the 1980s. However, fueled by shifts in population migration, Montana’s population grew by 103,000 people during the 1990s, an eightfold increase in population growth over the previous decade. About 85% of this population growth resulted from net in-migration, which was concentrated in the state’s Western Mountain region. The chart at the right shows population growth during the ‘90s by individual county from west to east in Montana. Montana’s fastest-growing counties are Ravalli (44% growth), Gallatin (34%), Broadwater (32%), Jefferson (27%), Lake (26%), Flathead (25%), Stillwater (25%), and Missoula (22%) – the only counties with gains of over 20% and counties all located in the Western Mountain region. Population growth in Montana declines almost systematically in going from west to east, with all but two of the 21 Eastern Plains counties losing population. The county with the single greatest percentage loss in population is Garfield County (-20%). The chart in the lower right shows total population change by major region for the last two decades. Population growth in the Western Mountains surged from 23,303 in the 1980s to over 88,000 in the 1990s. Significant growth also returned in the Central Front region. However, population decline continues in the Eastern Plains, although at a lower level. In all likelihood, a similar pattern of regional population change will continue in Montana, at least for the next ten to fifteen years.
Regional Differences in Income and Employment Growth Just as population growth is concentrating in the state’s Western Mountain region, so is income and employment growth. The chart in the upper right shows gains in total personal income during the last two decades by major region of Montana. In the last decade total personal income in statewide grew by almost $4 billion and about 73 percent in the income growth occurred in the Western Mountain region where personal income grew by almost $2.9 billion. This rise in total personal income in the West represented a 250 percent increase over the gain of the previous decade. So, income growth in the Western Mountain region has greatly accelerated, following a similar pattern in population growth. Personal income grew by $974 million in the Central Front region, an increase of 270 percent over the previous decade. The 21 counties in Montana’s Eastern Plains region accounted for only 2.5 percent of all income growth in the last decade. During the 1990s, total employment in Montana grew by over 126,000 jobs, including both full and part-time employment. Seventy-three percent of this job growth occurred in the Western Mountain region. Another 24 percent of the growth occurred in the Central Front. Quite clearly, all major measures of economic growth and expansion indicate that this growth is occurring overwhelmingly in the Western Mountain region. It is highly likely that income and employment growth are following in the footsteps of population expansion in the West, which is resulting from changes in the larger pattern of migration.
Net Migration Among Non-metro Forestland Counties in the West – 1980-1990 versus 1990-1999 Population growth in these forestland counties has been spurred by a “sea change” in migration patterns in the West, with more and more people moving to these types of areas. This growth coincides with significant declines in the wood products manufacturing industry in these areas, which is resulting in large-scale economic restructuring in the economies of these areas.
Areas Nearby National Parks In the West There are 80 western counties whose geographic center is within 40 miles of a major national park in the West. The majority of these (51) are non-metropolitan in character. The map shows major national parks in the 22 contiguous states west of the Mississippi River. Other federal lands adjacent to these parks are also shown.
Recent Employment Change in the Fast-growing Rockies and in Montana In the last decade when the economy of the Rocky Mountain West became one of the fastest-growing regional economies in the nation, employment growth in the broad services sector accounted for 37 percent of all new jobs in the region. The top chart shows employment change in the five-state region by major sector over the course of the last twenty years. There are 13 major sectors of the economy and two of these, services and retail trade, now account for nearly half of all employment. The sector with the third highest employment is Finance, Insurance, and Real Estate, or the F.I.R.E. sector, which is followed by manufacturing, construction, and local government (which includes public education). There is a common perception in Montana that the state’s economy is deteriorating, with many citing the growth in service and retail trade jobs and the loss of other “good” jobs in the economy. In actuality, the changing mix of jobs in Montana closely parallels the changing mix of jobs in the larger Rocky Mountain West region; which has seen significant gains in economic performance in recent years. In the last decade while service jobs grew by 37 percent in the fast-growing Rockies, they grew by 42 percent in Montana. And, while services and retail trade now account for nearly half of all jobs in the Rockies, they accounted for 49 percent of jobs in Montana in 2000. When you compare employment trends in Montana with the larger Rocky Mountain region, there are differences. F.I.R.E. is also the fourth highest major sector of employment rather than third as in the Rockies. Manufacturing is seventh, rather than fourth. And farm and ranch employment is sixth in Montana rather than twelfth.
Region Economic Restructuring: Greatest Growth and Greatest Decline SUB-SECTOR CHANGE IN ROCKIES, ’87 – ‘97 Fast-Growing Sub-Sectors (2000 dollars) #1 Business services +$5.8 bil. +130% #2 F.I.R.E., other than depos. + $4.5 bil. +108% #3 Health care services + $4.4 bil. + 64% #4 Special trade contractors + $3.4 bil. + 88% #5 Communications + $2.8 bil. +103% #6 Engineering & managmt serv.+ $2.6 bil. + 78% #7 Eating & drinking places + $1.4 bil. + 57% #8 Electric, gas & sanitary serv.+ $1.0 bil. + 60% #9 Auto dealers & service stations + $1.0 bi. + 51% +$27.0 (53%) Declining Sub-Sectors Oil & gas expl. & extract. - $ 38 mil. - 2% Coal Mining - $116 mil. - 13% Railroads - $136 mil. - 13% Net farm income - $216 mil. - 10% Transpt. Equip. mfg., not autos- $439 mil. - 25% U.S. Military - $570 mil. - 17% There are more than 70 different “sub-sectors” of the economy and the ways in which the economy is ‘restructuring” can be viewed by identifying where the “biggest gains” and “biggest losses” are occurring. In the fast-growing Rocky Mountain West region, labor income growth has been focused in “business services” (including such areas as accounting, advertising, computer, management services, etc.), F.I.R.E. non-depositories (insurance, real estate, brokers, etc.), health care services (doctors and hospitals), special trade contractors (carpenters, plumbers, electricians, etc.), communications (telephone, radio and television, etc.), and engineering and management services; all with gains in excess of $2 billion. Declines were focused in U.S. military, transportation equipment manufacturing other than autos, agriculture, railroads, and mining.
Area Economic Restructuring: Greatest Growth and Greatest Decline SUB-SECTOR CHANGE IN MONTANA, ’87 – ‘97 Fast-Growing Sub-Sectors (2000 dollars) #1 Health care services + $408 mil. + 49% #2 F.I.R.E., other than depos. + $223 mil. + 96% #3 Special trade contractors + $197 mil. + 67% #4 Business services + $177 mil. + 85% #5 Engineering & managmt serv.+ $127 mil. + 69% #6 Eating & drinking places + $106 mil. + 41% #7 Auto dealers/service stations + $ 91 mil. + 44% #8 Social services + $ 90 mil. +117% #9 General building contractors + $ 78 mil. + 54% + $1.5 bil. (64%) Declining Sub-Sectors U.S. Military - $14 mil. - 6% Coal mining - $ 18 mil. - 20% Trucking & warehousing - $ 21 mil. - 7% Railroads - $ 28 mil. - 13% Lumber & wood prod. Mfg - $ 48 mil. - 15% Net farm income - $173 mil. - 45% There are more than 70 different “sub-sectors” of the economy and the way in which the economy is ‘restructuring” can be viewed by identifying where the “biggest gains” and “biggest losses” are occurring. In Montana, the five fastest-growing sub-sectors of the economy during the period from the late ‘80s to the late ‘90s are health care services, F.I.R.E. non-depositories, special trade contractors, business services, and engineering and management services; all with gains of over $100 million in labor earnings. Declining sub-sectors in Montana include production agriculture, lumber and wood products. railroads, trucking and warehousing, coal mining, and the U.S. military.
Major Population Centers or Region “Cores” and Closely-Linked Counties in the West
Urban/Rural Features of Population Growth in Montana While most Montanan’s don’t think of the state as being “urban,” most of the state’s population lives in or nearby one of the state’s seven principal population centers. Montana has seven major population centers including Billings (Yellowstone), Missoula (Missoula), Great Falls (Cascade), Helena (Lewis and Clark), Butte (Silver Bow), Bozeman (Gallatin), and Kalispell/Whitefish (Flathead). While small by national standards, most of these cities and the city regions surrounding them are growing. As they do, they’re achieving market area population thresholds necessary for sustained growth and economic diversification. The chart at the right shows population growth among Montana’s city regions. The multi-county areas included in each, shown in the previous map, include the area’s regional center or core county and surrounding counties closely-linked to these regional centers. Twenty-eight of Montana’s 56 counties are closely-linked to one of the state’s seven regional centers. The remaining 21 counties are more isolated and rural areas, largely in the north central and eastern half of the state. The lower chart shows population growth in Montana since 1980 by county type: regional centers, closely-linked, and rest of state. Recent population growth is focused in regional centers and their surrounding areas. The greatest growth is in the Billings, Missoula, Kalispell, Bozeman, and Helena regions. Growth is flat in the Great Falls region, heavily dependent upon agriculture and the Malmstrom Air Base. The Butte region, historical center of Montana’s mining industry, also is flat. Much of the rest of Montana – the more isolated, more rural, and more agriculturally dependent portions of the state, largely in the East – is experiencing steady population decline.
Urban/Rural Features of Income and Employment Growth in Montana Just as population growth in Montana is increasingly focusing in the state’s largest cities and their surrounding areas, so is overall growth in income and employment. As shown in the chart at the right, personal income in the state’s seven regional center counties, which grew by over $1 billion in the ‘80s, grew by more than $3 billion in the ‘90s, a threefold increase in growth. Personal income in counties closely-linked to these regional centers, which grew by $450 million in the ‘80s, grew by nearly $745 million in the ‘90s. Together, the regional centers and their closely-linked areas accounted for over 96 percent of all income growth in the state in the last decade. With concentrated growth in these city regions, Montana’s more urban areas now account for 87 percent of statewide personal income and this concentration will continue to grow in the future. Statewide employment also is concentrating in the state’s city regions. During the last decade, total employment – both full and part-time employment of all types – grew by over 92,000 jobs in the seven regional centers, by over 28,000 jobs in closely-linked counties, and by only 5,700 jobs in the rest of the state. As with population growth and personal income growth, employment growth has been greatest in the Billings and Missoula regions. Employment also is sharply rising in the Bozeman and Kalispell regions, and to a lesser degree, in the Helena region. Total employment is growing at a much more modest rate in the Great Falls and Butte regions, the state’s two city regions with very flat population growth.
Long-term Consolidation and Decline in the Region’s Natural Resource Industries For much of the state’s history, Montana has depended on three pillars of the economy - agriculture, mining, and wood products. The chart at the right shows inflation-adjusted labor earnings for each of Montana’s natural resource industries since 1980. Included in the chart are farm and ranch production (“net farm income”), wood products manufacturing, and three sub-sectors of mining (metals and non-metal/non-fuels, oil and gas, and coal mining). Year-by-year earnings in agriculture have been erratic. Wood products earnings are flat or declining, as is the case with metals and non-metals mining and oil and gas. And while more coal is mined in Montana almost each year, it is usually done with fewer workers and labor earnings by these workers are flat or declining. In spite of this decline or stagnation in the state’s natural resource industries, the larger economy of the state has continued to grow. The chart in the lower right shows total personal income and statewide labor earnings in relation to the combined labor earnings of all natural resource industries for each year since 1980. What’s more, growth in income and labor earnings has accelerated over the course of the last decade. The state’s resource industries continue to be important to Montana’s overall economic prosperity. However, the state’s narrow dependence on these industries is declining and future growth will largely occur in other segments of the economy. However, some areas of Montana, particularly isolated rural areas in the East, will continue to be narrowly dependent on one or more of these industries.
Montana’s Natural Resource Industry Dependence While the state’s resource industries are very important components of the economy, Montana’s economic dependence on these industries is steadily declining. This reflects both long-term decline in these industries and expansion and diversification of the economy in other sectors.
Montana’s Struggling Farm and Ranch Sector In Montana as in most other agricultural regions of the U.S., production agriculture has been struggling. Total cash receipts from agricultural sales on a year-to-year basis regularly fall below total production expenses and the difference in net gains or losses is determined by income of agricultural producers from other sources including government farm programs.
Regional Distribution of the Fast-growing Services Sector With service sector growth dominating all other sectors in employment growth in Montana and the larger region, it alone is having a major impact on the distribution of the larger economy of the state. The chart at the right shows major sub-sectors of the services sector and their labor earnings growth since the last ‘80s. Health care services are the single largest component and dwarf all other service sub-sectors. Far behind in second place within this sector is business services, followed by engineering and management services. There is little doubt that growth in these areas would favor urban areas and city-region size population and market areas. The lower chart shows the distribution and growth of service sector labor earnings for the state’s regional center counties, counties closely-linked to these urban areas, and the rest of the state. Service sector activity has been steadily expanding in the regional centers, doubling in size between 1980 and the mid-1990s and continuing to grow. Services activity in counties closely-linked to these regional centers grew beyond activity in the rest of the state in 1989. This gap has steadily widened since then. Together, the seven regional centers and their closely-linked counties accounted for 95 percent of all service sector growth in Montana during the last decade. To the degree that economic expansion in Montana continues to be focused in services and other trade sectors, such growth will continue to concentrate more and more of the state’s overall economy in and around these regional centers.
Economic Well-being in Montana While recent trends in population, income, and employment growth in Montana are placing increasing emphasis on Montana’s cities and city regions as “engines” of economic growth, these cities also are where the state’s greatest economic prosperity resides. The chart at the right shows per capita income in Montana by area type – regional centers, closely-linked counties, and rest of the state. While per capita income statewide lags behind most states across the country, per capita income levels among Montana’s regional centers are very competitive with regional centers of similar population size throughout the western United States. However, similar comparisons for counties nearby these regional centers and the more isolated rural areas of the state show that per capita income in most of these areas lags behind levels for comparable areas in the West. Other measures of economic well-being, such as median household and family income and area poverty rates – also indicate that income levels are considerably lower in Montana’s outlying and rural areas. This suggests that many of the more positive aspects of economic restructuring and change are tending to focus in the state’s regional centers, translating into per capita income gains. On the other hand, many of the more negative aspects of restructuring and change, such as under-employment and wage decline, are tending to focus in outlying and rural areas. The gap between income levels in isolated areas and regional centers is widening, reflecting important advantages of more populated places and market areas in the changing economy.
Lessons to Learn from Emerging Economic Patterns Look Forward Promising strategies for economic improvement must reflect where the economy is going, not where it has been. Customize Strategies Needs and opportunities vary widely from place to place. Goals and strategies must likewise vary. Cities Matter Recognizing that most growth is focusing in and around “city regions,” more attention needs to be focused on the needs of cities as the “settings” if not the “engines” of economic growth, diversification, and advancement. In Montana, we need to assist cities, not deny that we have any. Urban-Rural Relations Matter Pursuing economic development town-by-town or county-by-county is difficult. Influencing local economies sub-region by sub-region with healthy urban-rural partnerships has potential. Become “Learning Communities” Successful businesses are adaptive businesses. Successful communities are adaptive communities. Adaptive communities must be “learning communities,” keeping abreast of change. Think about “Regional Positioning” Local economies can’t be remade by local leaders. What they can do is find ways of better positioning themselves – businesses, schools, work forces, governments, families – for future change. Anticipate future change and position yourself for it. Human-Resource Based Economy The economy is less and less “natural resource based,” and more and more “human resource based.” Do we know how to invest in human resource development? Well-designed, well-funded, adaptive systems for education and work force development are essential for economic prosperity. Environment as a “Key Economic Asset” In the new economy, a quality environment is a key economic asset. Protecting and enhancing environmental qualities is not the enemy of economic development. It is essential for economic prosperity.
Total Tax Revenues in Montana In actual dollars or dollars unadjusted for inflation, state and local tax revenues from all sources have steadily risen over time, as shown in the top chart. This rise is much less pronounced when these dollar amounts are adjusted for inflation, as shown in the lower chart. Source: 1998 – 2000 Biennial Report, Montana Dept. of Revenue
Montana Tax Revenues as a Share of Income Actual tax collections as a share of total personal income reflect the size of the state’s tax burden in relation to the size of Montana’s economy. Tax revenues as a share of income Have steadily fallen from as high as 10.24% in 1985 to a low of 7.78% in 2002. State revenues are not growing as fast as are incomes. Source: 2000-2002 Biennial Report, MT Department of Revenue