Download
1 / 12
120 likes | 477 Vues
HEAVY AXLE LOADS ON SHORT LINES AND REGIONAL RAILROADS. Georgia Railroad Association 5 th Annual Transportation Conference June 8 – 10, 2003 Young Harris, GA. Heavy Axle Loads and North American Railroad Network.

E N D
HEAVY AXLE LOADS ON SHORT LINES AND REGIONAL RAILROADS Georgia Railroad Association 5th Annual Transportation Conference June 8 – 10, 2003 Young Harris, GA
Heavy Axle Loads and North American Railroad Network • North American Class 1 Railroads are moving to heavier cars and higher axle loads • Double stack cars operate at up to 39 ton axle loads • Bulk commodity cars operate at 286,000 lb. gross weight on rails • 36 ton axle loads • Significant operating savings for: • Class 1 railroads • Shippers • Serious potential impact for Short Lines & Regional Railroads • Potential impacts on short lines and regional railroads • Safety • Maintenance of Way costs
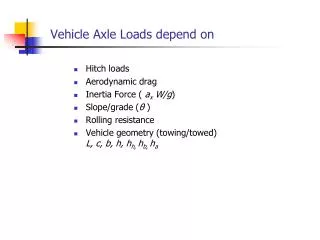
Effects of Heavy Axle Load Traffic • Heavy axle load studies on Class 1 railroads show HAL most strongly effects MoW costs for - Rail and joints - Ties and fastenings - Ballast and surfacing - Turnouts and special track work - Bridges
Effects of Heavy Axle Load Traffic on Short Lines & Regionals Effects of HAL traffic on Short Lines and Regional Railways • Increase in surface degradation at joints, particularly cross-level • Need for ongoing monitoring program • Increased degradation at turnouts • Increase in surface spalling of rail • Potential for increased rail defects, particularly at joints • Potential for broken rail derailments • Need for ongoing monitoring program • Increase in tie degradation at joints • Potential capital costs for bridges • Particularly bridges marginal at 263,000 lb.
Heavy Axle Load Damage Factors Damage* Damage* (per axle) (per MGT) Rail Wear +9% 0% Rail Fatigue(internal) +29% +19% Rail Fatigue (surface) +16% + 7% Rail Joints +32% +21% Ties +13% + 4% Good Ballast +9% 0% Poor Ballast +60% +47% Turnouts +29% +19% *Based on 286,000 lb. car
HAL Effects • Using ZETA-TECH HAL analyses models, following effects were predicted for operation of 286,000 lb. HAL cars • If all (100%) traffic is converted to HAL cars: • Increase in rail and turnout maintenance costs (to include capital costs associated with rail and turnout replacement): 28% • Increase in tie costs: 12% • Increase in surfacing costs: 23% Overall increase in maintenance costs associated with rails, ties, ballast, and turnouts:17%
Study Methodology • A sample of railroads from ASLRRA’s membership • Calculation of track miles requiring new rails, ties, ballasting, and bridge upgrade/replacement • Site Interviews performed • Information quantified specific capital requirements as a function of: • operating speed • annual traffic volume • rail weight • tie condition • ballast condition • bridge condition
Study Sample • 46 railroads of approximately 550 in the industry • 4,742 track miles of an estimated total of 49,985 • Average annual tonnage per mile ranging from 0.1 MGT to 16 MGT • Operating speed ranging from 10 mph to 50 mph • FRA track class from “excepted” to Class 5 • Large regional railroads (Wisconsin Central, Florida East Coast) excluded from the analysis to avoid skewing the sample
Findings of the Analysis Component Action Rail22% of track miles must be replaced Ties43% of track miles require at least some ties, depending on current tie condition Ballast23% of track miles require additional ballast; surfacing will also be required when ballast is added Bridges 22% require replacement; 27% require upgrading
Costs • The total cost of this required investment was calculated by use of standard railroad industry unit costs for: • Rail installation • Tie installation • Ballasting and surfacing • Turnout replacement • Bridge replacement (cost per track foot for timber, steel, concrete bridges) • Costs were based on use of new components, since a track rehab program of this size would quickly exhaust supplies of secondhand rail, secondhand ties, and turnouts
Conclusions: Required Investment Component Required Total Cost Total Cost Investment (Sample) (Industry) Rail and Turnouts $ 75,106 $356,150,175 $3,754,182,002 Ties $ 16,372 $ 77,636,048 $ 818,362,236 Ballast/Surfacing $ 2,657 $ 12,597,440 $ 132,789,720 Turnouts $ 7,882 $ 37,377,454 $ 393,996,056 Total $137,253 $650,847,006 $6,860,583,787 Track Mileage 4,742 49,985
Conclusions • US Railway industry is moving towards heavier axle load • Overall economic benefit to Class 1 railroads and shippers • Short Lines & Regional will be required to accept HAL equipment • Increase in maintenance of way costs • Projected increase of the order of 5 to 17% • Potential large need for capital; particularly for rail and bridges • ASLRRA is implementing a program to develop tools for members to: • Assess the potential impact of HAL traffic on their operations • Manage their rail condition and rail assets under HAL operations • Assess the overall economics of HAL operations on a railroad specific basis