Download
1 / 26
280 likes | 457 Vues
Informatics and Drug Discovery. Peter Goodfellow. 20 th Century Health Achievements. Vaccination Control of infectious diseases Decline in deaths from coronary heart disease and stroke Family planning Healthier mothers and babies Fluoridation of drinking water

E N D
Informatics and Drug Discovery Peter Goodfellow
20th Century Health Achievements • Vaccination • Control of infectious diseases • Decline in deaths from coronary heart disease and stroke • Family planning • Healthier mothers and babies • Fluoridation of drinking water • Safer and healthier foods • Recognition of tobacco use as a health hazard • Motor vehicle safety • Safer workplaces Source: CDC MMWR April 02, 1999 / 48(12);241-243 http://www.cdc.gov/mmwr/preview/mmwrhtml/00056796.htm
AIDS Mortality and Protease Inhibitor Use Deaths Deaths per 100 person-years Therapy with a PI (% of patient-days) Use of protease inhibitors 1994 1995 1996 1997 1998 Year Palella et al. N Engl J Med 1998
Drug Discovery Output of New Molecular Entities 120 100 Index (% of 1994 output) 80 60 1994 1995 1996 1997 1998 1999 2000 2001 2002 2003 Year Source: CMR International
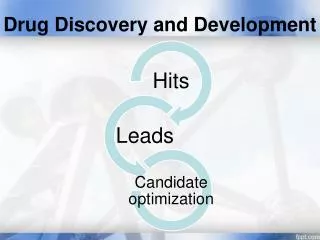
chemicaldiversity proteintargets identify‘hit’ optimize‘hit’ structure database /genes test safety/efficacy animals humans The Drug Discovery Process The aim is to translate new information into new therapies
Complexity of Drug DiscoveryFinding a Molecule that Satisfies Multiple Criteria 1 Drug Molecule manufacturable patentable non-mutagenic non-teratogenic durable reversible non-inducing metabolically stable permeable soluble physically stable potent 10,000 Drug Candidates selective Valid Biomedical Hypothesis? targeted
Complexity of Drug DiscoveryFinding a Molecule that Satisfies Multiple Criteria 1 Drug Launch Regulatory filing Competitive profile Cost-effective manufacturing Carcinogenicity studies Long-term safety Efficacy Side effect profile Dosing ranges Patient recruitment Trial sites and investigators Stability Formulation 10 Drug Molecules Safe and active in lab and animal models All discovery criteria met
Predictive Models • A predictive model quantitatively relates a number of descriptors (variable factors that are likely to influence future behaviour or results) to an outcome. • In marketing, for example, a customer's gender, age, and purchase history (descriptors) might predict the likelihood of a future sale (outcome). • In drug discovery, descriptors tend to be derived from chemical structure, and outcomes are in vitro or in vivo phenomena • the goal is to predict behaviour before synthesis • models can be built from experimental data too: • e.g. prediction of %F from solubility, permeability and clearance data
Statistics • Various statistical methods are applied to find the mathematical relationship between the descriptors and the outcomes • multiple linear regression, logistic regression K-nearest neighbours, PLS, linear discriminant analysis, decision trees, neural networks, Support Vector machines and many more • Choice depends on • data type/volume • the objectives for the model (see later) • personal preference
Modelling Decisions • Model in vivo or an in vitro surrogate? • in vivo ideal, but often limited data set • in vitro is itself a model for in vivo • but data generation is easier • E.g. Absorption • Caco-2 cell in vitro data vs in vivo perfusion data • Use of data • Is the data good enough to be left as “real” numbers e.g. pIC50? • Or should it be used as a category e.g. “high, medium, low”? • Do you want to filter “bad”, prioritise “good” or both? • Do you need to avoid false positives or negatives? • One is usually more important than the other
Uses of Predictive Models in Discovery • Lead generation • Filtering of structures to remove poor start points from screening collection • “Lipinski’s rules”, sub-structure filters, hard to remove or critical properties like poor solubility, permeability and hERG interaction • Even 70% predictive models are useful, as they can enrich the proportion of “good” compounds coming in • Hit to candidate • Used to guide medicinal optimisation • Predictive power and interpretability are key • Interpretability can often compensate for poor predictive power, as gives insights to the chemists as to what might solve the problem • Candidate attrition • Predictive ADMET used as another component of “risk assessment” for taking a candidate forward, to aid formulation studies, or to help interpret the result of an experiment
Modelling Retention Times on HPLC Q. Given about half a million good quality retention times and chemical structures, can we build a model of retention time that would be of use? Pred. RT Mean Absolute error = 0.23 mini.e. 14 seconds Abs. Error Exptl. RT Chris Luscombe CIX
Initial Filter from a Developability AssayInterpretable rule, filters “bad” compounds, with low false positive rate 143/160 compounds in the box are active
DEEP – Detecting Adverse Events Systems for Signal Detection DEEP Partnership with Lincoln Technologies This system has now been deployed at FDA, CDC,large Pharma (Pfizer, Lilly, Bayer, BMS, J&J, Roche, AZ) DEEP DEEP (Data Explorationand Evaluation in Pharmacovigilance) Scientific PublicationsNew strategies to evaluate poly-therapy, drug interactions and demographic “risk factors” for AEs
Safety Data Mining Enables Rapid and Systematic Identification of Safety Signals With post-marketing data, it is difficult to distinguish signals from noise. Safety Data Mining (SDM)/disproportionality methods identify AEs that are reported with > expected frequency (statistical independence) Frequency is assessed against the background of all other drugs and events. Results are used for hypothesis generation. Bayesian methodology to estimate relative reporting rates (risks) of AEs Enhanced effectiveness of post-marketing pharmacovigilance through rapid, systematic screening of AE databases Enhanced benefit-risk management
Bayesian Methods to Assess the Frequency of Specific Drug-Adverse Event Combinations Drug X All other Drugs Event of interest C A All other Events D B An empirical Bayesian methodology estimates relative reporting rates Is A>C ?? A+B C+D
Interpretation Wonderex - Rash (16 reports in the database) • EBGM: 3.0 EB05: 1.8 EB95: 4.3 • Wonderex-rash combination is reported at 3-fold greater frequency than if there were no association between Wonderex and rash • 95% confidence that the true relative reporting rate is at least 1.8 • 95% confidence that the true relative reporting rate does not exceed 4.3
0 EB05 1 < EB05 2 < EB05 4 < EB05 8 < EB05 < Enhanced Pharmacovigilance Had these tools previously been available, critical signalsmight have been identified years before they were recognized with traditional pharmacovigilance. They are now used routinely .
Benefit-risk management-Pharmacovigilance planning Competitive intelligence Regulatory agency queries Regulatory submissions for PLEs Characterizing factors associated with rare serious AEs In-licensing due-diligence Exploring drug interactions and polytherapy in ‘real world use’ Understanding the effects of litigation/publicity on safety signals Evaluating indication-specific safety profiles in products with multiple indications Evaluating rare serious events in special populations (i.e., children) Signal assessment for our co-licensed products Advisory committee preparation DEEP Provides Information to Reconise Product Performance and Benefit-Risk Ratio:
NSAIDS & COX-2 Inhibitors: AERS to 3Q03(Suspect drugs)
Cardiovascular and Stroke-Related-AEs Subset Analysis: Age < 50 yr AERS through 3Q 2003
Chemical Safety: Using human safety data to determine which structural features of drugs contribute to their toxicities Identify associations between fragments and signals,by calculating diagnostictest statistics. A positive signal (EB05 5 ) is used as the ”gold standard.” The presenceof a fragment in drug represents a “positive test.” Identify drug-event pairs with EB055(designate as "signals"). Run datamining algorithm (MGPS). Create a chemical fragment library for all drug structures in AERS using MoSS to create fragments ranging in size from 4-10 atoms. Diagnostic test statistics For a given fragment-event pair: Odds ratio of 20 means that the odds of having a specific "signal" are 20 times greater if the fragment is present (in the molecule) than if it is not Positive predictive value of 0.4 means that 40% of drugs containing the fragment will have a “signal” for that adverse event
Thanks to: • Darren Green, John Leonard, June Almenoff and Trevor Gibbs for sharing slides • Colleagues who taught me about drug discovery • SB and GSK for letting me play with a very big chemistry set