Download
1 / 74
740 likes | 963 Vues
Methamphetamine Crime in Virginia. Virginia Criminal Sentencing Commission September 17, 2007. Methamphetamine. Sources: About Meth/Dangers to Children, Arizona’s Drug Endangered Children Program: Protecting Arizona’s Children http://www.azag.gov/DEC/about_meth.html

E N D
Methamphetamine Crime in Virginia Virginia Criminal Sentencing Commission September 17, 2007
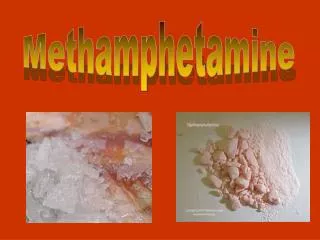
Methamphetamine Sources: About Meth/Dangers to Children, Arizona’s Drug Endangered Children Program: Protecting Arizona’s Children http://www.azag.gov/DEC/about_meth.html Photo Library, U.S. Drug Enforcement Administration http://www.dea.gov/photo_library3.html Methamphetamine and Meth Labs, Minnesota Department of Health http://www.health.state.mn.us/divs/eh/meth/methdrug.html
National Survey on Drug Use and Health • U.S. Department of Health and Human Services - Substance Abuse and Mental Health Services Administration (SAMHSA) • Formerly the National Household Survey on Drug Abuse (NHSDA), the NSDUH has provided information on the use of alcohol, tobacco, and illicit drugs by the civilian, non-institutionalized population since 1971 • Interviews approximately 70,000 Americans age 12 or older over a 12 month period • Indicators of drug use for many drug types: • Ever used • Used in last year • Used in last month Source: Results from the 2005 National Household Survey on Drug Abuse” Volume I, Summary of National Findings U.S. Department of Health and Human Services - Substance Abuse and Mental Health Services Administration Office of Applied Studies
In 2005, roughly 19.7 million Americans age 12 or older (8.1%) used an illicit drug during the month prior to the survey interview (termed “current illicit drug users”) A small percentage (.2%) reported current use of methamphetamine 6.0% used marijuana in the past month 1.0% used cocaine .3% used crack .2% used ecstasy .1% used heroin Respondents Reporting Illicit Drug Use Source: Results from the 2005 National Household Survey on Drug Abuse” Volume I, Summary of National Findings U.S. Department of Health and Human Services - Substance Abuse and Mental Health Services Administration Office of Applied Studies
Age of Current Illicit Drug Users • The majority of individuals reporting current drug use (52%) were 25 and under, with the highest rate of use among adults 18 to 20 years old Source: Results from the 2005 National Household Survey on Drug Abuse” Volume I, Summary of National Findings U.S. Department of Health and Human Services - Substance Abuse and Mental Health Services Administration Office of Applied Studies
Drug Use Over Time • Between 2002-2003 and 2004-2005, the percentage of respondents reporting past month illicit drug use decreased from 8.3% to 8% • This change was mirrored by a similar decline in Virginia, from 7.7% in 2002-2003 to 6.8% in 2004-2005 • There was a statistically significant decrease from 11.9% to 8.3% among respondents between the ages of 12 and 17 in Virginia • While this decline was also observed on the national level, the difference was only -1.2% for the same time period Source: Results from the 2005 National Household Survey on Drug Abuse” Volume I, Summary of National Findings U.S. Department of Health and Human Services - Substance Abuse and Mental Health Services Administration Office of Applied Studies
Monitoring the Future • Funded by the National Institute on Drug Abuse, administered by the University of Michigan’s Institute for Social Research • This study has gathered information on illicit drug use by students in the 12th grade since 1975 • In 1991, 8th and 10th grade students were added to the sample • Interviews approximately 50,000 8th, 10th, and 12th graders in the United States each year • Added questions regarding methamphetamine in 1999 amidst increasing concern over the use of methamphetamine in general • Questions relating to “ice” use have been included in the annual survey of 12th graders since 1990 • Measures how many times respondents used particular drugs: • in their lifetime • during the past 12 months • during the past 30 days Source: “Monitoring the Future: National Results on Adolescent Drug Use, Over view of Key Findings 2005” U.S. Department of Health and Human Services – National Institute on Drug Abuse. NIH Publication 06-5882.
Percentage of Current Drug Use Among 12th Graders • The percentage of 12th grade students reporting marijuana use in the past 30 days decreased from 21% in 2003 to 18.3% in 2006, although it remains the most commonly reported drug • Current cocaine use increased by .4% between 2003 and 2006 • Use of the other major drugs declined during this time period Source: “Monitoring the Future: National Results on Adolescent Drug Use, Over view of Key Findings 2006” U.S. Department of Health and Human Services – National Institute on Drug Abuse. NIH Publication 07-6205.
Use of Methamphetamine in the Past 30 Days • While 10th graders demonstrated the highest rate of methamphetamine use in the late 1990s, 12th graders overtook them in 2003, 2004, and 2006 • The percentage of 10th and 12th grade students reporting methamphetamine use in the past 30 days has greatly decreased since 2000, from 2% to .7% and 1.9% to .9%, respectively Source: “Monitoring the Future: National Results on Adolescent Drug Use, Over view of Key Findings 2006” U.S. Department of Health and Human Services – National Institute on Drug Abuse. NIH Publication 07-6205.
Virginia Community Youth Survey (CYS) • Modeled after the national Monitoring the Future project • Funded by the Virginia Department of Mental Health, Mental Retardation, and Substance Abuse Services (DMHMRSAS), administered by the Virginia Commonwealth University Center for Public Policy • Conducted in 2000, 2003, and 2005 • Duplicates questions in the Monitoring the Future survey but leaves out additional descriptions of drugs, including slang terms • Does not differentiate between cocaine and crack or meth and ice Source: “2005 Virginia Community Youth Survey” Virginia Commonwealth University Center for Public Policy for theVirginia Department of Mental Health, Mental Retardation, and Substance Abuse Services.
Use of Illicit Drugs by 12th Graders, 2005 Lifetime Past 30 Days National Virginia • The percentage of 12th graders in Virginia reporting that they used methamphetamine or ice at least once in their lifetime was slightly higher than the national rate in 2005 • The percentage of 12th graders in Virginia reporting cocaine or crack use in the past 30 days was higher than the national rate Sources: “2005 Virginia Community Youth Survey” Virginia Commonwealth University Center for Public Policy for theVirginia Department of Mental Health, Mental Retardation, and Substance Abuse Services. “Monitoring the Future: National Results on Adolescent Drug Use, Over view of Key Findings, 2005” U.S. Department of Health and Human Services – National Institute on Drug Abuse. NIH Publication 06-5882. Monitoring the Future Data Set, 2005, Inter-University Consortium for Political and Social Research, University of Michigan Institute for Social Research
Percentage of High School Students in Virginia Reporting Methamphetamine or Ice Use Source: “Virginia Community Youth Survey,” 2003 and 2005. Virginia Commonwealth University Center for Public Policy for the Virginia Department of Mental Health, Mental Retardation, and Substance Abuse Services.
Northern Northwest Eastern Southwest Central Percentage of Reported Methamphetamine or Ice Use Among High School Students, 2005 Source: “2005 Virginia Community Youth Survey” Virginia Commonwealth University Center for Public Policy for theVirginia Department of Mental Health, Mental Retardation, and Substance Abuse Services.
Treatment Episode Data Set (TEDS) • Established by the US Department of Health and Human Services – Substance Abuse and Mental Health Services Administration (SAMHSA) • Gathers demographic and substance abuse characteristics of admissions to substance abuse services from state administrative systems (DMHMRSAS in Virginia) • TEDS data understates the number of admissions in Virginia since the information submitted to TEDS does not include emergency admissions • Using Community Service Boards (CSBs), DMHMRSAS collects information from publicly-funded providers of mental health, mental retardation, and substance abuse services within the Commonwealth • A change in the method of data collection by DMHMRSAS in 2004 resulted in a greater number of providers reporting to the CSBs than in past years • This change in reporting creates a problem in comparing raw numbers from prior years to data gathered after fiscal year 2004 • DMHMRSAS is not very confident in the validity of data from fiscal years 2004 and 2005, although the data is improving Source: “Treatment Episode Data Set (TEDS) Highlights – 2005: National Admissions to Substance Abuse Treatment Services” Department of Health and Human Services – Substance Abuse and Mental Health Services Administration Office of Applied Studies.
Substance Abuse Admissions in Virginia by Primary Drug Type Change in reporting Source: Treatment Episode Data Set, Drug and Alcohol Services Information System (DASIS) U.S. Department of Health and Human Services - Substance Abuse and Mental Health Services Administration
Methamphetamine Admissions in Virginia by Source of Referral Change in reporting SABRE funds available *Includes referrals from self-help groups, religious organizations, and federal, state, and local agencies providing aid in the areas of poverty relief, unemployment, shelter, or social welfare Note: Schools and employers each comprised a small percentage of referrals. In 2005, schools and employers combined accounted for less than 1% Source: Treatment Episode Data Set, Drug and Alcohol Services Information System (DASIS) U.S. Department of Health and Human Services - Substance Abuse and Mental Health Services Administration
Methamphetamine Admissions in Virginia Related to Smoking Methamphetamine • Smoking methamphetamine is a more addictive method of ingestion due to its connection to ice, a purer form of the drug • The percentage of admissions in Virginia relating to smoking methamphetamine increased from 16.7% in 1993 to 48.5% in 2005 Sources: Treatment Episode Data Set, Drug and Alcohol Services Information System (DASIS) U.S. Department of Health and Human Services - Substance Abuse and Mental Health Services Administration “Methamphetamine: Abuse and Addiction” (2006) Research Report Series. National Institute on Drug Abuse – National Institutes of Health
Treatment Admissions in Virginia by Age, 2005 Source: Treatment Episode Data Set, Drug and Alcohol Services Information System (DASIS) U.S. Department of Health and Human Services - Substance Abuse and Mental Health Services Administration
Number of Cases with Substances Submitted to the Department of Forensic Sciences • The number of cases involving methamphetamine increased from 366 in 2000 to 1,084 in 2006 • Counting cases with multiple drugs as a single case, the total number of drug cases involving marijuana, cocaine, heroin, or methamphetamine increased from 40,085 to 43,266 from 2000 to 2006 Note: Multiple types of drugs can be reported in each case. Source: Virginia Department of Forensic Sciences
Average Weight of Drugs per Drug Case (in grams) Source: Virginia Department of Forensic Sciences
National Forensic Laboratory Information System Regions Source: “National Forensic Laboratory Information System 2005 Annual Report” Volume I, Summary of National Findings. U.S. Drug Enforcement Administration - Office of Diversion Control.
Primary Drug Type Submitted by Region West Midwest South Northeast Note: Includes state and federal sources Source: “National Forensic Laboratory Information System 2005 Annual Report” Volume I, Summary of National Findings. U.S. Drug Enforcement Administration - Office of Diversion Control.
Amount of Methamphetamine Seized by Federal Agencies, by State (in grams) Source: “DEA Briefs & Background, State Factsheets” 2003-2007. U.S. Drug Enforcement Administration.
Virginia’s Methamphetamine Provisions • § 18.2-248(C): • Selling, manufacturing, distributing or possessing with the intent to distribute 10 grams or more of methamphetamine or 20 grams or more of a methamphetamine mixture is a felony with a 5 year mandatory minimum term of imprisonment unless certain criteria are met • § 18.2-248(C1): • Manufacturing up to 200 grams of a methamphetamine mixture is punishable by 10 to 40 years for the first conviction and 10 years to life for a second or subsequent conviction; a third conviction carries a 3 year mandatory minimum term • § 18.2-248(H1): • Selling, manufacturing, distributing or possessing with the intent to distribute at least 100 grams but less than 250 grams of methamphetamine or 200 grams but less than 1 kilogram of methamphetamine mixture is a felony with a 20 year mandatory minimum • § 18.2-248(H2): • Selling, manufacturing, distributing or possessing with the intent to distribute at least 250 grams of methamphetamine or at least 1 kilogram of methamphetamine mixture is a felony with a mandatory minimum of life
Addressing Methamphetamine Precursors in the Commonwealth • On September 1, 2005, Governor Mark Warner issued Executive Directive 8, mandating that: • The State Health Commissioner issue an order limiting quantities that can be purchased of precursor ingredients used to manufacture methamphetamine • Further comprehensive educational efforts to help curb methamphetamine use be developed • DMHMRSAS develop a plan for treatment of methamphetamine addiction • The emergency order became effective on October 1, 2005 and expired on July 1, 2006 Source: “Curbing Methamphetamine Manufacture and Use” Executive Directive 8 (2005), Commonwealth of Virginia Office of the Governor
Managing Precursors • The subsequent Order Finding Imminent Danger to the Public Health and Requiring Corrective Action, issued by the Virginia Department of Health, restricted the sale of methamphetamine precursors • Retailers must collect and maintain records of purchases of ephedrine or pseudoephedrine • Retailers cannot sell more than 9 grams of precursor ingredients in one transaction • Retailers must keep products with ephedrine or pseudoephedrine as the only active ingredient behind a store counter • Consumers must provide photo identification before acquiring precursors • Consumers cannot obtain more than 9 grams of precursors in one transaction Source: “Order Finding Imminent Danger to the Public Health and Requiring Corrective Action”Commonwealth of Virginia, Virginia Department of Health
Actions by the Virginia General Assembly • In 2005, §18.2-248(J) of the Code of Virginia was added • Any person who possesses two or more methamphetamine precursors with the intent to manufacture methamphetamine is guilty of a Class 6 felony • §18.2-248.8 was created in 2006 • Retail sales are limited to 3.6 grams of ephedrine or pseudoephedrine daily per customer • Retailers keep products containing ephedrine or pseudoephedrine behind a store counter or locked container that is not accessible to consumers • Retailers maintain a written or electronic log of purchaser and product identifying information unless the product contains less than 60 milligrams of pseudoephedrine • Purchasers furnish government issued photo identification
Child Endangerment and Clandestine Labs • §18.2-248.02 was added in 2005 • Any person 18 years of age or older who maintains a custodial relationship over a child and who knowingly allows that child to be present in the same dwelling, apartment, hotel unit, garage, shed, or vehicle during the manufacture of methamphetamine is guilty of a felony punishable by imprisonment for 10 to 40 years
Marijuana arrests increased from 13,559 arrests in 2000 to 16,569 in 2006 The total number of drug arrests increased from 23,181 to 32,000 between 2000 and 2006 Drug Arrests in Virginia, 2000-2006 Source: Crime in Virginia Reports, 2000 through 2006, Virginia Department of State Police
Percentage of Drug Arrests by Drug Type • As the proportion of drug arrests related to marijuana decreased from 2000 to 2006, the percentage of arrests related to crack, heroin, amphetamines/methamphetamine, and other drugs increased while the percentage for cocaine remained fairly stable • However, this pattern may be an artifact of the growth of missing data and the fact that the type of drug was missing from more than a tenth of drug arrests for the past four years Source: Crime in Virginia Reports, 2000 through 2006, Virginia Department of State Police
Drug Arrests in Virginia by Age, 2006 Total:1,724 Total:1,694 Total:1,206 Total:1,236 Total:1,149 Total:1,156 Total:937 Total:759 Total: 224 Note: Total amounts exclude arrests involving marijuana Source: Crime in Virginia Reports, 2006, Virginia Department of State Police
Juvenile Arrests in Virginia Source: Crime in Virginia Reports, 2000 through 2006, Virginia Department of State Police
Methamphetamine Lab Seizures in Virginia Reported by DEA September 1, 2005 - Governor Warner issues Executive Directive 8 * Data for 2006 are preliminary – Due to lags in reporting time, the number of seizures known to the DEA may change Source: Drug Enforcement Administration – El Paso Intelligence Center Clandestine Laboratory Seizure System
2003 Total:24 0 1-2 3-4 5-6 7-9 10+ Clandestine Lab Seizures in Virginia 2000 Total:1 2001 Total:5 2004 Total:65 2002 Total:10 2005 Total:48 Source: Drug Enforcement Administration – El Paso Intelligence Center Clandestine Laboratory Seizure System
0 1-2 3-4 5-6 7-9 10+ Clandestine Lab Seizures in Virginia, 2006* Total:18 Pulaski 1 Dickenson 2 Wythe 4 Wise 1 Washington 4 Smyth 1 Carroll 1 Pittsylvania 1 Amelia 1 Henrico 1 Grayson 1 *Data are preliminary Source: Drug Enforcement Administration – El Paso Intelligence Center Clandestine Laboratory Seizure System
Reported Clandestine Lab Incidents – Surrounding States *Data are preliminary Note: Data for Maryland was not available for 2000 and data for Washington DC was only available for 2004 –available data shows 1 clandestine lab incident in Washington, DC in 2004 Source: Drug Enforcement Administration – El Paso Intelligence Center Clandestine Laboratory Seizure System
Number of Children Affected by Clandestine Laboratories The DEA’s Clandestine Laboratory Seizure System defines children affected as children residing at or visiting a clandestine lab site *Data are preliminary Note: Information for Maryland and Washington, DC was not available Source: El Paso Intelligence Center Clandestine Laboratory Seizure System - U.S. Drug Enforcement Administration
Mexican Drug Trafficking Organizations • The number of domestic methamphetamine labs seized nationally has decreased substantially since 2003 • Reports from the National Drug Intelligence Center (NDIC) and the Drug Enforcement Administration describe an increase in the involvement of Mexican Drug Trafficking Organizations (DTOs) in methamphetamine manufacturing and trafficking since 2002 • The NDIC and DEA attribute a rise in the ice form of methamphetamine to Mexican DTOs’ capability to produce higher purity methamphetamine in superlabs located in Mexico Sources: “National Methamphetamine Threat Assessment 2007” National Drug Intelligence Center – U.S. Department of Justice “Drug Information: Methamphetamine” Drug Enforcement Administration – U.S. Department of Justice
Mexican Drug Trafficking Organizations in Virginia – Circuit Court Convictions • Virginia PSI data contain information regarding the place of birth of individuals convicted in circuit courts and offer a rough indicator of the presence of Mexican DTOs • The majority (65.1%) of convictions for methamphetamine-related offenses between fiscal year 2000 and fiscal year 2006 involved persons born in Virginia *Data for 2005 and 2006 are incomplete Source: Pre/Post-Sentence Investigation (PSI) Database, 1992-2006
Mexican Drug Trafficking Organizations in Virginia – Federal Convictions • The United States Sentencing Commission gathers data relating to defendants’ country of citizenship • The percentage of methamphetamine trafficking convictions in federal courts in Virginia involving Mexican citizens peaked at 20% in 2002 * Data for 2006 are incomplete – through federal fiscal year 2006 Source: United States Sentencing Commission Data Set
United States Mexico Outside US, Not Mexico Mexican Drug Trafficking Organizations Nationwide, 2005 Arizona had the largest proportion of distribution convictions in Federal courts relating to Mexican citizens (64.62%) in 2005 Note: Hawaii is included in the Southwest and Alaska is grouped with the Northwest Source: United States Sentencing Commission Data Set
Federal Methamphetamine Convictions in Virginia, 2005 • 173 of the 178 federal cases involving methamphetamine in 2005 (97.2%) had methamphetamine or a meth precursor as the primary drug (incurs highest penalty) • 144 were a meth mix, 4 involved a methamphetamine precursor, 9 were ice, and 16 were high purity methamphetamine • 2 cases had cocaine or crack as the primary drug and methamphetamine as a secondary drug (1.1%) and 3 cases (1.7%) had Ecstasy as the primary drug N=173 Note: “High purity methamphetamine” represents the category of “meth.actual” in the federal sentencing guidelines data and captures cases with relatively high purity Sources: United States Sentencing Commission Data Set “1998 Federal Guidelines Manual” Appendix C, Amendment 395. United States Sentencing Commission.
Methamphetamine Convictions in Federal Courts in Virginia by District * Data are incomplete – through federal fiscal year 2006 Source: United States Sentencing Commission Data Set
Methamphetamine Convictions in Federal Courts in Virginia by Type of Meth 4 Precursors 1 Precursor 2 Ice 4 Precursors 1 Precursor 0 Ice 0 Precursors 1 Ice 0 Precursors 0 Ice * Data are incomplete Source: United States Sentencing Commission Data Set