Download
1 / 24
240 likes | 354 Vues
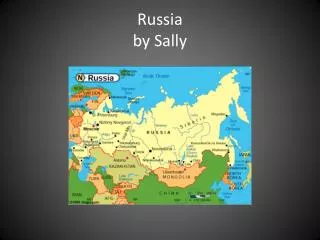
Strengthening Natural Resources Management building on Local Knowledge Systems for Sustaining the Productivity and Viability of Agricultural Heritage Systems. Presentation by Sally Bunning, Land Management Officer, FAO. Multitude of traditional agricultural systems. Agricultural systems

E N D
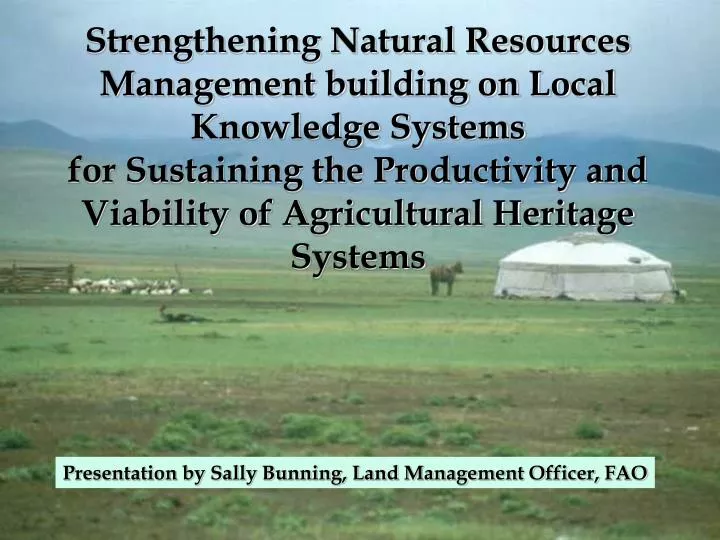
Strengthening Natural Resources Management building on Local Knowledge Systemsfor Sustaining the Productivity and Viability of Agricultural Heritage Systems Presentation by Sally Bunning, Land Management Officer, FAO
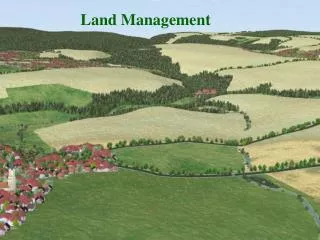
Multitude of traditional agricultural systems Agricultural systems • Pastoralist • Mixed rainfed farming: crops, livestock, trees, fish • Irrigated agriculture • Agro-forestry/multi-storey Developed from natural vegetation and ecosystems • grasslands • bush/shrub/forest system • wetlands incl. oases Adapted to agro-ecological zone: dry, (sub)humid, tropical... Make use of planned and wild species and habitats Continuously adapting to socioeconomic context & knowledge
Hunger Task Force- Millennium Project Who are the Hungry and where is Aid channeled today: • Paradigm that 92% of the hungry suffer chronic malnutrition and only 8% suffer from extreme events but disproportionate amount of development aid targets emergencies (civil strife, drought, flood) • Of the hungry (Sarah Scherr): • 50% smallholders; • 20% landless; • 20% urban poor and • 10% forest dwellers, pastoralists and fisherfolk • Hunger hot spots (nutrition, poverty,...) The Project will focus on 6 priorities: • Political action • Enabling policy reform • Agricultural productivity of food insecure } to address • Market access and income generation } community • Restoring natural assets } wellbeing • Improve nutrition of vulnerable } +health
Agricultural Landscapes and Biodiversity Biophysical determinants • Farm size and fragmentation • Soil types, slope and water availability • Mix of enterprises e.g. maize, beans, fruit trees • Variation in space and time: intercrops, field borders, rotations, fallows • Maintenance and use of wild species (trees, hedges) Socio-economic determinants • Population pressure • Socio-economic status – tools, capital, inputs • Access to natural resources and tenure security • Knowledge and skills – IK and modern • Community organisation and decision making- by laws • Policy and infrastructure: roads, water, markets
Pressures on ecosystems Example of a Dryland ecosystem • Clearing, fragmentation, habitat conversion(incl. impact on wetlands/ aquatic systems) • Intensification and inappropriate land use:(population pressures, economic drivers e.g. trend toHYV) • Over-exploitation and harvesting of natural resources:(traditional, socio-economic, cultural e.g. land tenure / user rights) • Alien invasive speciese.g. weeds, pests, diseases, pathogens Sensitive, Resilient environments but pressures lead to degradation, biodiversity loss, reduced productivity + loss of ecosystem services
Ecosystem approach – interactions Management practices - household and community • Soil and water management • Selection of crops and livestock types • Grazing and cropping intensity • Use of inputs: seed, fertilizer, pesticide, irrigation, feed • Fire regime- burning of residues, natural vegetation • Pest and disease management • Common property resources- woodlots, wetlands, State of Agricultural biodiversity Loss of pasture, crop, tree varieties/ species, animal breeds (gene pool) Decline in wild genetic resources Loss of production support services- pollination, pest control, soil fertility, soil water retention Determine State of NR and Soil health + water quality Species + habitats Pest impacts: weeds, disease Ecological functions- hydro-logical regime, nutrient and carbon cycles State of People/Livelihoods: Income; food security, nutrition, risk alleviation/vulnerability, health, available options
Interactions farm-household to micro-catchment to river basin B A C
What can we look at to understand the interactions and human responses? Indicators of • Overall Ecosystem Functioning- resilience, recovery • Soil health - impacts on H20 regime, fertility, C stocks • Vegetation – protection, food and other goods, • Water quality and recharge- food, access to water • Agricultural biodiversity – ecosystem, species, genetic levels • Food and livelihood security – nutrition, hungry periods • Management practices- returns/unit labour, win-win, community • Policy and legal incentives/regulations- local empowerment Selection of simple monitoring indicators with stakeholders: (land users, community, local authority, technical sectors) - as a tool for management at local, community and district level - to demonstrate value/benefits, status/trends for sectoral/policy consideration Minimum Set of indicators at various levels depends on • user needs, local knowledge • priority issues • management strategies
Who to involve and what to focus on Local level:Participatory PRA process, local team- range of resource users/stakeholders; local knowledge+ indicators • Field, boundaries, farm-household: focus on local knowledge, quality of resources (soil, water, biological) on site processes/health - Micro-catchment (land use- habitat change, species loss, processes, impacts on livelihoods) Agro-ecological zone, agro-ecosystem level Interaction among technical sectors with communities to identify key issues, successes and constraints, minimum set of indicators, e.g. micro to larger catchment effects (groundwater recharge, water quality, flood events, road damage etc…), productivity, food security... District authorities can help identify planning and impact indicators Link to national level data Work with planners/policy makers to demonstrate multiple values of AHS, compare with higher inputs systems (cost/benefits; pilots – national support)
Interactions and knowledge systems within the community • Farm Households – FHH, MHH, landless, labour force, AIDS affected... • Farmer types- small-large, access to resources single-diverse enterprises, off farm income, education, skills • Ethnic/social groups- pastoral, cropping, mixed; labourers • Decision makers – • Knowledge systems are differentiated by gender and socioeconomic groups- each member has valuable knowledge and use sit in different ways for survival and livelihood goals GIAHS should among others improve recognition and help communities to address inequality issues: tenure security, inheritance rights of women, access to resources (land, water trees etc).
Biodiversity management and local livelihoods Closely interlinked, complex and locally specific Coping strategies of local populationscan be affected through degradation, loss of biodiversity, pressures on resources, poor health and nutrition Need understanding of the dynamic relationships and of • socioeconomic drivers (popn, disease, poverty, policy failure), • pressures and impact on resources, and • impacts of environmental condition on different societal groups to design initiatives that address poverty and biodiversity conservation to develop effective and sustainable policy options Two way feedback: • Biodiversity can be a useful indicator of sustainability and livelihood security • Degradation and loss of biodiversity affects resilience, capacity and time to recover and increases vulnerability to food insecurity
Ecosystem level indicators for farm-household, micro-catchment and AEZ
Agrobiodiversity indicators • Crop diversity • Number of species cultivated • Share of crop varieties in total production of that crop • No. and propn of endangered crop varieties used • Livestock diversity • Proportion of various livestock categories • No. of breeds by livestock categories • No. and proportion of endangered breeds used • No. and type per household Nutritional status of households (gender; age) Food security of households • Weeds, pests, diseases, pathogens • Survival, growth, appearance • Incidence and spread • labour for weeding, alternatives e.g cover crops • Interspecies interactions – pollination, pest control, BNF • Links to Crop and livestock productivity
Soil, terrain and vegetation indicators Soil quality (biophysical condition) • Surface condition e.g. cover, sealing, ponding • Erosion: qualitative and quantitative • Salt deposits • Plant indicators (e.g. acid /infertile soils) • Plant nutrient deficiencies (and impacts) • Presence/abundance of earthworms (OM,porosity) Terrain • Slope %, position (erosion risk) • Aspect (risk of frost) Natural Vegetation • Species/taxa diversity: functional groups; key species • Structural diversity- storeys • Proportion/cover of alien or invasive species • Number/amount of wild food species consumed • Time taken to collect firewood
Water indicators • Quality • Flora and fauna (fish) bioindicators • Chemical characteristics: e.g. EC, pH, DO, P, N • Turbidity, sedimentation, nutrient load, algal blooms • % population with access to good water • Incidence/deaths from water-related diseases • Quantity • Levels + volumes: withdrawals, depth to water table, flow • Water shortage • Flood events and scale • Number of people and stock reliant on a source • Time taken to collect household water
Farm/land Management indicators • Livestock grazing/feeding regime (stocking weight, frequency, timing, intensity) • Tillage and sowing methods • Fertiliser/nutrient cycling strategies • Crop rotation, inter- and cover crop • Fallow, improved fallow • Water harvesting/management practices • Weed, pest and disease management • Fire regime • Protection of river banks
Food & livelihood security indicators • Farm size and area under cultivation • No. in HH by gender and age group • Dependency ratio • Education level • Income – HH, per capita, farm profits • Propn of income from livestock, crops, other • Land tenure • Agricultural productivity • Time to nearest market • Disasters (flood, drought, war) The Sustainable Livelihoods Framework (5 capitals: natural, physical, social, human, financial) is well suited to GIAHS
Benefits of Sustainable Land management example of Conservation Agriculture for Community +Catchment • More constant water flows in rivers, recharge wells/springs • Cleaner water (less erosion) • Less flooding • Less impact extreme climate • Less cost road/ waterway maintenance • Better food security For Farmers • Less labour, time • Less cost, inputs/power • More stable yields • Less risk • Increase yields • Increase profit • Nutrition + wellbeing At Global level: Carbon sequestration - less GHG emissions, soil restoration Minimal erosion (loss of potential + associated costs) Less fuel (for tractor powered 30-60% energy savings) Less nutrient leaching/water pollution; recharge of the aquifers
Arrangements to improve NRM • Upstream-downstream linkages in rural watersheds • land users upstream – erosion, runoff, sediments • water users downstream value water supply and quality • Pastoralists and smallholder farmers • pastoralists require access to dry season grazing • farmers need manure; need to manage vegetation • How can local NRM arrangements be supported? • Community support for woodlots, tree planting/perennials fruit and vegetables (e.g. fuelwood, nutrition...) • Farmer-pastoral agreements • District support to reduce costs of road damage, water .. • Labour sharing + planning among farm-households • Local by laws to control grazing, burning...
How can we support AHS for the environmental services they provide? • How to provide flexible, direct and promising compensation mechanisms by which service providers are: • paid by service users PES) or • supported in other ways by local/national governments • a) in (small) watersheds - mechanisms to compensate upstream landowners to maintain or modify a given land use which is affecting downstream water resource (regular flow, recharge, less salts/sediments, quality) • b) at a broader scale: instruments to pay (provide support) for wider environmental benefits e.g. biodiversity conservation, scenic beauty, carbon sequestration • Advantages : educate on value of NRM (economic, social, envt’l benefits), knowledge on impacts, promote efficient use of resources, resolve conflicts, support restoration, benefit sharing • Limitations: impacts; cost effectiveness, users willingness to pay, how to ensure demand driven, perverse incentives, sustainability,
Policy level: Opportunities and need for synergy among relevant processes • UNCCD NAPs – poverty and degradation links (dryland and drought focus); hotspots and bright spots • CBDNBSAPs - agro-biodiversity, dry and sub-humid lands, indicators and assessment; ecosystem approach • UNFCCC- climate change mitigation; Kyoto protocol- forestry and land use change • FAO State of worlds domestic animal resources and SOW plant genetic resources and International Treaty • World Food Summit + WSSD and MDG goals and action plans: Food security and sustainable agriculture and rural development • OECD- agro-ecosystem indicators; support for agricultural landscapes, water quality, etc. How can we optimise support to GIAHS through these processes?