Download
1 / 12
120 likes | 124 Vues
CO2 emissions from economic circuit in France: up to carbon footprint of final consumption by groups of households. Assessing environmental sustainability: building « carbon footprint » accounts. Dual labelling at macro level for every aggregate of SUT

E N D
CO2 emissions from economic circuit in France:up to carbon footprint of final consumption by groups of households
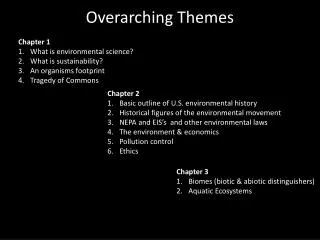
Assessing environmental sustainability: building « carbon footprint » accounts • Dual labelling at macro level for every aggregate of SUT • Which productive activities emit CO2 in France and in what proportion? • What quantities of CO2 emitted abroad via our imports? • What quantities of CO2 emissions for final consumption, investment, exports? • Is carbon footprint of final consumption evenly distributed among the French population? wealthy/poor, young/old…
North America Europe + Russia Asia CO2 emissions, GDP and population in the world GDP ppp CO2 Other France Population : 1% GDP : 3 % CO2 : 1.3 %, that is 410Mt population Data for 2005
410 Mt CO2 From CO2 emissions by industry in France… 1/3 4% 64% 2/3 32%
410 Mt CO2 … to CO2 emissions in France embodied in final demand by product Back from symetric SUT to standard SUT : CO2 footprint of trade and transport margins are reassigned to goods purchased
410 Mt CO2 emitted in France Taking into account imported CO2 emissions 550 Mt CO2 generated by final domestic demand of which 40% emitted abroad 60% emitted in France of which 75% HH consumption 10% GG consumption 15% investment
Zoom on consumption HH final consumption expenditures CO2 emissions other food food other hotels restaurants leisure culture housing housing hotels restaurants leisure culture
HH account : An indispensable account, built up directly at a macro level by way of « mirroring », thanks to the central NA framework… …that says however nothing about the heterogeneity of individual situations Bridging micro and macro approaches, on the basis of HH surveys First results (for France) HH account by category - standard of living, household composition, employment status, age of the head of household - in 2003 : income, final consumption expenditure, actual final consumption Bridging HH consumption expenditures by groups and carbon footprint calculations Breaking down the households’ account by groups
Standard of living, consumption and CO2 emissions By standard of living quintile X 3.4 X 2.7 CO2 emissions consumption
Standard of living, employment status, age and CO2 emissions
HH composition and CO2 emissions: economies of scale • consumption induces 6,4 tCO2 per year per person • up to 8,6 tCO2 per year per person living alone • only 4,1 tCO2 per year per person living in a large family (couple with 3 children or more)
For more information: http://www.insee.fr/en/themes/document.asp?reg_id=0&ref_id=ecofra10eThank you for your attention