Milwaukee school district
Milwaukee school district . Nicole Kathman. Milwaukee school district Fast facts (2009-2010). Largest school district in the state Pre-K through Grade 12 enrollment- 82,096 Attendance Rate 88.2 % Around $15,235 spent per student compared to La Crosse of around $13,877 Truancy Rate- 45.8%


Milwaukee school district
E N D
Presentation Transcript
Milwaukee school district Nicole Kathman
Milwaukee school district Fast facts (2009-2010) • Largest school district in the state • Pre-K through Grade 12 enrollment- 82,096 • Attendance Rate 88.2% • Around $15,235 spent per student compared to La Crosse of around $13,877 • Truancy Rate- 45.8% • Dropouts for Grades 7-12 2,114 or 5.86% • Homelessness- 2,869
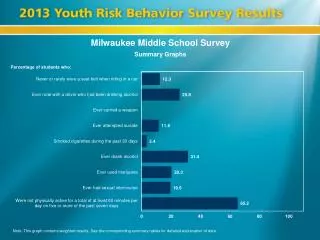
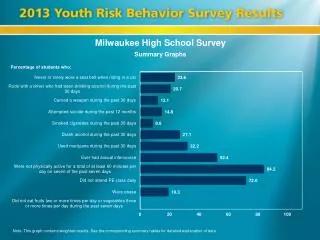
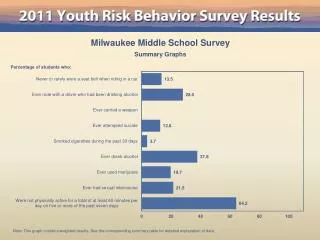
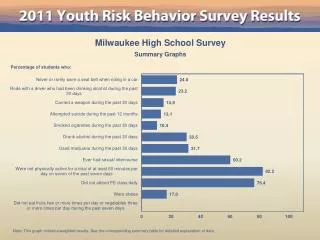
La Crosse Vs. Milwaukee vs. Madison 10th Grade Achievement Test Proficiency and Advanced
Extracurricular Activity Participation Attendance Rate for 10th grade So they can increase extracurricular activities and attendance…..
Race/Ethnicity Enrollment Economic Status
School data analysis • Victoria L. Bernhardt • Concept of using school data to make school improvements • Difference between success in school reforming and failure • Identify root cause of problems • Facts concerning what changes are needed • Target services to important issues • Know if goals are being accomplished • Demographics vs. Student Learning data Tells us whether specific groups of students are learning at the same level or not
Advanced Proficiency by race- 10th grade Race and Ethnicity clearly correlates with Advanced Proficiency for 10th grades students
Attendance- high school? 81.1% Attendance Rate for all 10th graders Attendance does not seem be distributed drastically by race but with improvement in attendance could show change.
Habitually truant? For all High School grades 10th grade Advanced Proficiency by Race/Ethnicity Important to note that 71.2% of all 10th graders habitually truant
Suspension Can see a relationship between race and suspension and race relates to performance
Proficiency by economic status- 10th grade • High School 76.9% disadvantaged, 23% advantaged
Attendance- High school 81.1% Attendance Rate for all 10th graders
Suggestions for Milwaukee • Promote Extracurricular Participation • Stricter Attendance Policies/Truant Polices • More funding/support for economically disadvantaged families • Emphasis on ELL programs!
Sources • http://www.milwaukeepartnershipacademy.org/pubs/mps_strategic_plan_7-26-07.pdf • http://dpi.state.wi.us/lbstat/data.html • https://apps2.dpi.wi.gov/sdpr/district-report.action • http://www.jsonline.com/news/education/mps-scores-near-bottom-in-national-test-gd3beua-135224608.html