Download
1 / 1
10 likes | 176 Vues
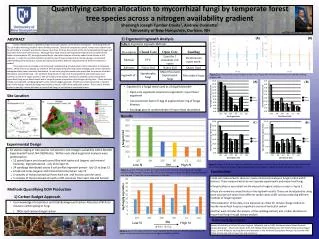
Site Location. B. Low N. Low N. High N. High N. Experimental Design. Six stands ranging in tree species composition and nitrogen availability within Bartlett Experimental Forest, NH (NEON site). Within each stand ergosterol analyses were performed on:

E N D
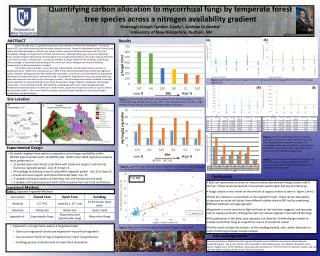
Site Location B. Low N Low N High N High N Experimental Design • Six stands ranging in tree species composition and nitrogen availability within Bartlett Experimental Forest, NH (NEON site). Within each stand ergosterol analyses were performed on: • 12 paired (open and closed) cores filled with native soil (organic and mineral horizons). Ingrowth period - July 15 to Sept 15 • 24 sandbags distributed across 6 soil profiles Ingrowth period - July 15 to Sept 15 • 6 bulk soil cores (organic and mineral horizons) taken July 15 • 5 samples of the processed soil from each site and horizon (at time zero) • 5 samples of the processed soil with a 10% inoculum from each site and horizon Quantifying carbon allocation to mycorrhizal fungi by temperate forest tree species across a nitrogen availability gradient ShersinghJoseph Tumber-Davila1, Andrew Ouimette1 1University of New Hampshire, Durham, NH sjg79@wildcats.unh.edu (A) (B) Results ABSTRACT Carbon dioxide (CO2) is a greenhouse gas that traps radiation in the Earth’s atmosphere. Increasing levels of CO2can lead to warming and alter other climate processes. Terrestrial ecosystems contain 3 times more carbon than the atmosphere, and each year forests release more than 10 times the amount of CO2 to the atmosphere through soil respiration than fossil fuel emissions. Although these large natural soil respiration fluxes tend to be balanced by fixation of atmospheric CO2 through photosynthesis, the carbon balance of forests under future climate is still unknown. In order for scientists to better model the role of forests under future climate change, an improved understanding of the amount of carbon allocated and stored in different compartments of forest ecosystems is needed. This project aims to provide a more thorough understanding of whole-plant carbon allocation in temperate forests. While trees may allocate up to 50% of their photosynthetically fixed carbon belowground, carbon allocation belowground has been historically overlooked. In particular, very few studies have quantified the amount of carbon allocated to mycorrhizal fungi – the symbiotic fungi found on tree roots that provide the plant with water and nutrients in return for sugars (carbon). We will employ three distinct methods to quantify carbon allocation to mycorrhizal fungi across forest stands with a range of species composition and nitrogen cylcing rates.These methods include core ingrowth, sandbag ingrowth, and a carbon budget approach. Preliminary results show that in nutrient poor conifer forests, mycorrhizal fungi may receive as much as 30% of the total plant carbon. This is one of the first studies to quantify carbon allocation to mycorrhizal fungi in northeastern temperate forests. Figure 4.μg of ergosterol per g of organic matter by soil type with (A) showing mineral soils and (B) showing organic soils (A) (B) Figure 1. grams of fungal carbon per meter squared for the bulk soil samples. 10 T and 6N represent high elevation N-poor sites, 32P is a low elevation N-poor site, 9D is a high elevation N-rich, site and C2 and 14Z are low elevation N-rich sites Figure 5. Figures A and B shows the annual fungal production in grams per meter squared across all six sites using ingrowth production numbers, and estimating that the ingrowth period is approximately one third of the growing season. Figure 5(A) shows mineral soils and 5(B) shows organic soils. Figure 6.Shows mycorrhizal ingrowth in milligrams of biomass per gram of organic matter. Mycorrhizal estimates are created by subtracting the closed core values form the open cores. Ingrowth Cores Fraction of NPP Figure 2. grams of fungal carbon per meter squared for the bulk soil samples, separated by the organic and mineral horizons across a nitrogen availability gradient. r2=0.588 Conclusions • Bulk soil measurements show an inverse relationship between fungal carbon and N richness. These measurements do not separate saprotrophic and mycorrhizal fungi • fungal carbon is very reliant on the amount of organic matter as seen in figure 2 and 3. • There are numerous uncertainties in the ingrowth results. These can be adjusted by using more accurate soil values from different studies done at BEF and by combining different methods of fungal ingrowth. • Ergosterol is not as sensitive to light and heat as the literature suggests, and exposing soils to copious amounts of disruption will not remove ergosterol, but will kill the fungi • The publication of this data, once adjusted, can allow for climate change models to include mycorrhizal fungi as a significant source of terrestrial carbon • Further work includes the analysis of the sandbag method, and carbon allocation to mycorrhizal fungi through isotope analysis Ergosterol Method Table 1:Ergosterol Ingrowth Methods • Ergosterol is a fungal sterol used as a fungal biomarker • Open core ergosterol-closed core ergosterol= mycorrhizal ergosterol • Use conversion factor of 3μg of ergosterol per mg of fungal biomass • Sandbags give an underestimate of mycorrhizal abundance Figure 3. Regression of soil fungal abundance versus soil organic matter (SOM). Acknowledgements Research funded by a McNair Scholars Program Fellowship and an USDA Northerneastern States Research Cooperative grant . My sincere thanks to Dr. Erik Hobbie, Matt Vadeboncoeur, Paul Pellesier, Ben Smith, Mary Santos, Megan Grass, Connor Madison, JaturongKumla and everyone in the Terrestrial Ecosystems Analysis Lab and the UNH Stable Isotope Lab with all your help and assistance