Download
1 / 7
70 likes | 327 Vues
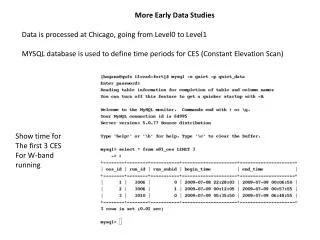
More Early Data Studies. Data is processed at Chicago, going from Level0 to Level1 MYSQL database is used to define time periods for CES (Constant Elevation Scan). Show time for The first 3 CES For W-band running. Year-month-date-hour-min-sec. 1/5 of a Constant Elevation Scan (CES).

E N D
More Early Data Studies Data is processed at Chicago, going from Level0 to Level1 MYSQL database is used to define time periods for CES (Constant Elevation Scan) Show time for The first 3 CES For W-band running
One Constant Elevation Scan (CES) azimuth elevation Q2 demod Time in Days
Akito suggested us (Fermilab) to look at white noise (anti) correlation between: Q1 and Q2 U1 and U2 For Q-band data taking, correlation was large (.4) What is it for W-band ? For some modules in W-band, this was large. I have started to look at this. But I am still tweaking the algorithm
Module 00 shown Search for Correlation of White Noise between Q1 and Q2 Q1 Q2 mV2/Hz (Q1 - Q2)/2 (Q1 + Q2)/2 No evidence for white noise correlation