Download
1 / 33
330 likes | 547 Vues
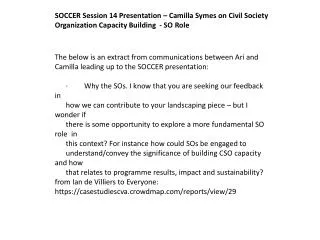
What Researchers Want. Links from this talk: bit.ly/ stmwant. Cody Dunne Dept. of Computer Science and Human-Computer Interaction Lab, University of Maryland cdunne@cs.umd.edu STM 3 rd Master Class November 7-9, 2011 Adelphi, MD, USA. Researchers want to…. Find a specific paper

E N D
What Researchers Want Links from this talk: bit.ly/stmwant Cody Dunne Dept. of Computer Science and Human-Computer Interaction Lab, University of Maryland cdunne@cs.umd.edu STM 3rd Master Class November 7-9, 2011 Adelphi, MD, USA
Researchers want to… • Find a specific paper • Explore a research area • Do retrospective analysis • Share their results
1. Find a specific paper • Metadata or PDF? • From memory (search) • From reference list • DOI/URL • Search
2. Exploring a research area • Foundations • Emerging research topics • State of the art/open problems • Collaborations & relationships between Communities • Field evolution • Easily understandable surveys
User requirements • Control over the paper collection • Choose custom subset via query, then iteratively drill down, filter, & refine • Overview either as visualization or text statistics • Orient within subset • Easy to understand metrics for identifying interesting papers • Ranking & filtering • Create groups & annotate with findings • Organize discovery process • Share results
Action Science Explorer • Bibliometriclexical link mining to create a citation network and citation context • Network clustering and multi-document summarization to extract key points • Potent network analysis and visualization tools www.cs.umd.edu/hcil/ase
Citation network overview Communities, outliers, invalid data
Statistics & visualization • Network statistics • Degree • Betweenness • Closeness • Pagerank • Attributes • Year • Downloads • Citations • References
Citation context & summarization • Citation context • Key contributions • Critical reception • Citations to subsequent/similar work • Hyperlinked citations in text • See surrounding context of citation • View cited papers while reading • Multi-document summarization • Citation context • Abstract • Full text
3. Retrospective analysis • Automatic collection & processing of bibliometric data • Easy access to visual analytic tools for finding clusters, trends, outliers • Communities for sharing data, tools, & results
STICK Project • Scientific, data-driven way to track innovations • Vs. current expert-based, time consuming approaches (e.g., Gartner’s Hype Cycle, tire track diagrams) • Includes both concept and product forms • Study relationships between • Study the innovation ecosystem • Organizations & people • Both those producing & using innovations stick.ischool.umd.edu
Case study: tree visualization • Problem: Traditional 2D node-link diagrams of trees become too large • Solutions: • Treemaps: Nested Rectangles • Cone Trees: 3D Interactive Animations • Hyperbolic Trees: Focus + Context • Measures: • Papers, articles, patents, citations,… • Press releases, blog posts, tweets,… • Users, downloads, sales,…
Treemaps: nested rectangles www.cs.umd.edu/hcil/treemap-history
SmartmoneyMarketMap Feb 27, 2007 smartmoney.com/marketmap
Cone trees: 3D interactive animations Robertson, G. G., Card, S. K., and Mackinlay, J. D., Information visualization using 3D interactive animation, Communications of the ACM, 36, 4 (1993), 51-71. Robertson, G. G., Mackinlay, J. D., and Card, S. K., Cone trees: Animated 3D visualizations of hierarchical information, Proc. ACM SIGCHI Conference on Human Factors in Computing Systems, ACM Press, New York, (April 1991), 189-194.
Hyperbolic trees: focus & context Lamping, J. and Rao, R., Laying out and visualizing large trees using a hyper-bolic space, Proc. 7th Annual ACM symposium on User Interface Software and Technology, ACM Press, New York (1994), 13-14. Lamping, J., Rao, R., and Pirolli, P., A focus+context technique based on hy-perbolic geometry for visualizing large hierarchies, Proc. SIGCHI Conference on Human Factors in Computing Systems, ACM Press, New York (1995), 401-408.
Case study: tree visualization impact TM=Treemaps CT=Cone Trees HT=Hyperbolic Trees Trade Press Articles Academic Papers Patents
Case study: tree visualization citations TM=Treemaps CT=Cone Trees HT=Hyperbolic Trees Academic Papers Patents
Case study: business intelligence • Proquest News 2000-2009 • Co-occurrence of concepts with organizations • Data Mining • National Security Agency • White House • FBI • AT&T • American Civil Liberties Union • Electronic Frontier Foundation • Dept. of Homeland Security • CIA Year
Business Intelligence 2000-2009 Matrix showing Co-Occurrence of concepts and entities
Business Intelligence 2000-2009: (subset)
Business Intelligence • 2000-2009: • Data mining • NSA • CIA • FBI • White House • Pentagon • DOD • DHS • AT&T • ACLU • EFF • Senate Judiciary Committee
Business Intelligence • 2000-2009: • Tech1 • Google • Yahoo • Stanford • Apple • Tech2 • IBM, Cognos • Microsoft • Oracle • Finance • NASDAQ • NYSE • SEC • NCR • MicroStrategy
Business Intelligence • 2000-2009: • Air Force • Army • Navy • GSA • UMD*
STICK Process News Dissertation Academic Patent Blogs • Identify concepts • Query data sources • Processing • Automatic entity recognition • Crowd-sourced verification • Co-occurrence networks • Visualizing & analyzing • Overall statistics • Co-occurrence networks • Network evolution • Sharing results
4. Sharing results • Easily usable metadata (BibTeX, EndNote, etc.) • Collaborative authoring • Online communities
Collaborative literature reviews • Organized references • Annotated PDFs www.mendeley.com
Shared data & analysis repositories stick.ischool.umd.edu/community
Researchers want to… • Find a specific paper • Explore a research area • Do retrospective analysis • Share their results
What Researchers Want Links from this talk: bit.ly/stmwant Cody Dunne Dept. of Computer Science and Human-Computer Interaction Lab, University of Maryland cdunne@cs.umd.edu This work has been partially supported by NSF grants IIS 0705832 (ASE) and SBE 0915645 (STICK)