Mitigating Climate Change
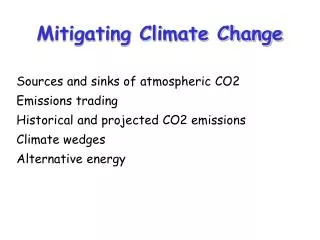
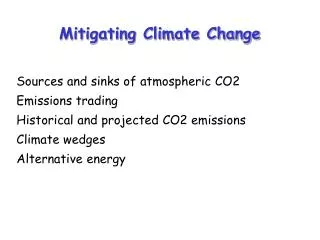
Mitigating Climate Change. Sources and sinks of atmospheric CO2 Emissions trading Historical and projected CO2 emissions Climate wedges Alternative energy. Atmosphere. Ocean. 775 + 4/yr. 38,000. The Global Carbon Cycle.

Mitigating Climate Change
E N D
Presentation Transcript
Mitigating Climate Change Sources and sinks of atmospheric CO2 Emissions trading Historical and projected CO2 emissions Climate wedges Alternative energy
Atmosphere Ocean 775 + 4/yr 38,000 The Global Carbon Cycle About half the CO2 released by humans is absorbed by oceans and land “Missing” carbon is hard to find among large natural fluxes ~120 ~90 ~120 ~90 8 GtC/yr Land Humans 2000
Variable Sinks Half the CO2 “goes away!” • Some years almost all the fossil carbon goes into the atmosphere, some years almost none • Interannual variability in sink activity is much greater than in fossil fuel emissions • Sink strength is related to El Niño. Why? How?
European Climate ExchangeFutures Trading: Permits to Emit CO2 • European “cap-and-trade” market set up as described in Kyoto Protocol (http://www.europeanclimateexchange.com) • 7/18/2008 price €25.76/ton of CO2 emitted 12/2008 = $149.73/ton of Carbon • Supply and demand!
Present Value of Carbon Sinks • Terrestrial and marine exchanges currently remove more than 4 GtC per year from the atmosphere • This free service provided by the planet constitutes an effective 50% emissions reduction, worth about $600 Billion per year at today’s price on the ECX! • Carbon cycle science is currently unable to quantitatively account for • The locations at which these sinks operate • The mechanisms involved • How long the carbon will remain stored • How long the sinks will continue to operate • Whether there is anything we can do to make them work better or for a longer time
Where Has All the Carbon Gone? • Into the oceans • Solubility pump (CO2 very soluble in cold water, but rates are limited by slow physical mixing) • Biological pump (slow “rain” of organic debris) • Into the land • CO2 Fertilization(plants eat CO2 … is more better?) • Nutrient fertilization(N-deposition and fertilizers) • Land-use change(forest regrowth, fire suppression, woody encroachment … but what about Wal-Marts?) • Response to changing climate(e.g., Boreal warming)
Coupled Carbon-Climate Modeling • “Earth System” Climate Models • Atmospheric GCM • Ocean GCM with biology and chemistry • Land biophysics, biogeochemistry, biogeography • Prescribe fossil fuel emissions, rather than CO2 concentration as usually done • Integrate model from 1850-2100, predicting both CO2 and climate as they evolve • Oceans, plants, and soils exchange CO2 with model atmosphere • Climate affects ocean circulation and terrestrial biology, thus feeds back to carbon cycle
Land 300 ppm! Atmosphere Ocean Carbon-Climate FuturesFriedlingstein et al (2006) • Coupled simulations of climate and the carbon cycle • Given nearly identical human emissions, different models project dramatically different futures!
Emission Scenarios • A1: Globalized, with very rapid economic growth, low population growth, rapid introduction of more efficient technologies. • A2: very heterogeneous world, with self-reliance and preservation of local identities. Fertility patterns across regions converge very slowly, resulting in high population growth. Economic development is regionally oriented and per capita economic growth & technology more fragmented, slower than other storylines. • B1: convergent world with the same low population growth as in A1, but with rapid changes in economic structures toward a service and information economy, reductions in material intensity, introduction of clean and resource-efficient technologies. The emphasis is on global solutions to economic, social, and environmental sustainability, including improved equity, without additional climate initiatives. • B2: local solutions to economic, social, and environmental sustainability. Moderate population growth, intermediate levels of economic development, and less rapid and more diverse technological change than in B1 and A1. Each “storyline” used to generate 10 different scenarios of population,technological & economic development
Emission Scenarios vs Reality Raupach et al. 2007 PNAS
Carbon intensity of the world economy fell steadily for 30 years Canadell et al. 2007
Until 2000! Canadell et al. 2007
Dramatic contrast – history versus future Developing India China Former Soviet Other developed Japan Europe USA CO2 emissions Cumulative Raupach et al. PNAS 2007
Dramatic contrast – history versus future Developing India China Former Soviet Other developed Japan Europe USA CO2 emissions Raupach et al. PNAS 2007
Dramatic contrast – history versus future Developing India China Former Soviet Other developed Japan Europe USA CO2 emissions Raupach et al. PNAS 2007
Dramatic contrast – history versus future Least Developed Developing India China Former Soviet Other developed Japan Europe USA CO2 emissions Raupach et al. PNAS 2007
Fossil Fuel Burning 8 ATMOSPHERE billion tons go in 4 billion tons added every year 800 billion tons carbon Ocean Land Biosphere (net) 4 2 2 + = billion tons go out CO2 “Budget” of the Atmosphere
ATMOSPHERE 1200 “Doubled” CO2 (570) 800 Today (380) Pre-Industrial 600 (285) 400 Glacial (190) Billions of tons of carbon ( ) billions of tons carbon ppm How Far Do We Choose to Go? Past, Present, and Potential Future Carbon Levels in the Atmosphere
Historical Emissions Billions of Tons Carbon Emitted per Year 16 Historical emissions 8 0 1950 2000 2050 2100
The “Stabilization Triangle” Billions of Tons Carbon Emitted per Year Current path = “ramp” 16 Stabilization Triangle Interim Goal Historical emissions 8 Flat path 1.6 0 1950 2000 2050 2100
The Stabilization Triangle Easier CO2 target Billions of Tons Carbon Emitted per Year Current path = “ramp” 16 ~850 ppm Stabilization Triangle Interim Goal Historical emissions 8 Flat path Tougher CO2 target ~500 ppm 1.6 0 1950 2000 2050 2100
“Satbilization Wedges” Billions of Tons Carbon Emitted per Year 16 GtC/y Current path = “ramp” 16 Eight “wedges” Goal: In 50 years, same global emissions as today Historical emissions 8 Flat path 1.6 0 1950 2000 2050 2100
Cumulatively, a wedge redirects the flow of 25 GtC in its first 50 years. This is 2.5 trillion dollars at $100/tC. A “solution” to the CO2 problem should provide at least one wedge. What is a “Wedge”? A “wedge” is a strategy to reduce carbon emissions that grows in 50 years from zero to 1.0 GtC/yr. The strategy has already been commercialized at scale somewhere. 1 GtC/yr Total = 25 Gigatons carbon 50 years
Nuclear Fission (1) Fifteen Wedges in 4 Categories Energy Efficiency & Conservation (4) 16 GtC/y Renewable Fuels & Electricity (4) Fuel Switching (1) Stabilization Stabilization Triangle Triangle CO2 Capture & Storage (3) 8 GtC/y Forest and Soil Storage (2) 2007 2057
Photos courtesy of Ford Motor Co., DOE, EPA Efficiency Produce today’s electric capacity with double today’s efficiency Double the fuel efficiency of the world’s cars or halve miles traveled Average coal plant efficiency is 32% today There are about 600 million cars today, with 2 billion projected for 2055 Use best efficiency practices in all residential and commercial buildings E, T, H / $ Replacing all the world’s incandescent bulbs with CFL’s would provide 1/4 of one wedge Sector s affected: E = Electricity, T =Transport, H = Heat Cost based on scale of $ to $$$
Fuel Switching Substitute 1400 natural gas electric plants for an equal number of coal-fired facilities Photo by J.C. Willett (U.S. Geological Survey). A wedge requires an amount of natural gas equal to that used for all purposes today E, H / $
Carbon Capture & Storage • Implement CCS at • 800 GW coal electric plants or • 1600 GW natural gas electric plants or • 180 coal synfuels plants or • 10 times today’s capacity of hydrogen plants Graphic courtesy of Alberta Geological Survey There are currently three storage projects that each inject 1 million tons of CO2 per year – by 2055 need 3500. E, T, H / $$
Nuclear Electricity Triple the world’s nuclear electricity capacity by 2055 Graphic courtesy of NRC The rate of installation required for a wedge from electricity is equal to the global rate of nuclear expansion from 1975-1990. E/ $$
Wind Electricity Install 1 million 2 MW windmills to replace coal-based electricity, OR Use 2 million windmills to produce hydrogen fuel Photo courtesy of DOE A wedge worth of wind electricity will require increasing current capacity by a factor of 30 E, T, H / $-$$
Solar Electricity Install 20,000 square kilometers for dedicated use by 2054 Photos courtesy of DOE Photovoltaics Program A wedge of solar electricity would mean increasing current capacity 700 times E / $$$
Remember • Half (4 GtC/yr) of the current emissions (8 GtC/yr) remain in the atmosphere and contribute to greenhouse forcing of downward longwave raditaion • Economic growth is on track to at least doubleCO2 emissions to 16 GtC/yr by 2050 • Reducing CO2 emissions requires choosing a combination of efficiency, fuel switching, and alternative energy generation (“wedges”) • Each “wedge” is feasible given today’s technology, but also expensive