Download
1 / 17
170 likes | 283 Vues
This project focuses on the creation and evaluation of daily high-resolution gridded observational datasets for Europe, covering variables such as Tmax, Tmin, Tmean, precipitation, and more from 1960 to 2004. It involves partners from KNMI, MeteoSwiss, University of East Anglia, and University of Oxford, aiming to improve climate simulations, scenario construction, and impact assessments. The dataset will undergo homogeneity testing, interpolation, and quality control to ensure accuracy and reliability for climate extremes analysis.

E N D
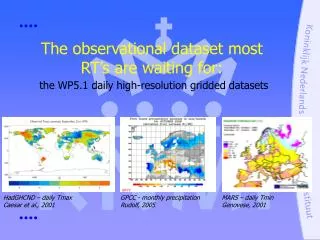
HadGHCND – daily Tmax Caesar et al., 2001 GPCC - monthly precipitation Rudolf, 2005 MARS – daily Tmin Genovese, 2001 The observational dataset most RT’s are waiting for:the WP5.1 daily high-resolution gridded datasets
Why? …developing dailyhigh-resolution gridded observational datasets for Europe? • Evaluation of the ENSEMBLES simulation/prediction system • Scenario construction • Impact assessment • Analysis of climate extremes
Project partners • KNMI, Lisette Klok & Albert Klein Tank • MeteoSwiss, Evelyn Zenklusen & Michael Begert • University of East Anglia, Malcolm Haylock & Phil Jones • University of Oxford, Nynke Hofstra & Mark New
Overview • Variables and grid • Stations and series • Homogeneity • Interpolation • Data availability
Variables and grid • daily observations • Tmax, Tmin, Tmean, RR, mslp, snow depth • regular 0.25 degree grid and/or an equal area grid • 1960-2004 or present Domain
ECA&D coverage 2004 Station locations Data sources: • ECA&D • EMULATE • STARDEX • GSN • GHCN - daily • MAP project • MARS 2033 stations
Series • 1831 precipitation • 1384 Tmax • 1388 Tmin • 1244 Tmean • 317 mslp • 180 snow depth • quality controlled • updated with SYNOP data
Homogeneity – results of the absolute test following the method of Wijngaard et al., 2004
Vera-QC (Begert et al., in preparation) Only complete series Period: 1960-2000 Number of break-points detected: 0() 1() 2() 3() >4() undefined () mean temperature precipitation Homogeneity – results of the relative test
Homogeneity – results of the relative test [°C] [°C] [°C] Frequency distribution of shift dimensions for temperature
Interpolation methods • Natural Neighbour Interpolation • Angular Distance Weighting • Thin Plate Splines • Kriging • Conditional Interpolation (only rainfall)
Selection of best method and validation • Cross validation • Remove one station and interpolate to location of that station • Compare results with observed values and calculate skill scores (e.g. RMSE, LEPS) • Comparison with grids from high resolution station series • E.g. UK 5*5 km rainfall, Switzerland rainfall and Norway • Compare results with gridded datasets and calculate skill scores
Interpolation results LEPS skill scores averaged across all methods
Uncertainties in the interpolation results • Still looking for appropriate method to determine uncertainties • Will be in the form of uncertainty bands around the interpolated value • Different uncertainty bands for every grid for every day
Data availability • Gridded datasets (September 2007): http://www.ensembles-eu.org/ >> RT5 site • Daily station series (if public!): http://eca.knmi.nl