High Resolution Melts HRM
corbett LIFE SCIENCE. High Resolution Melts HRM. Prepared by Andrea Tesoriero Presented by Jennifer McMahon. www.corbettresearch.com. High Resolution Melts. Analysis of change in fluorescence as a PCR product is melted.

High Resolution Melts HRM
E N D
Presentation Transcript
corbett LIFE SCIENCE High Resolution Melts HRM Prepared by Andrea Tesoriero Presented by Jennifer McMahon www.corbettresearch.com
High Resolution Melts Analysis of change in fluorescence as a PCR product is melted • PCR amplify an amplicon with two primers and an intercalation dye and then melt the product – double stranded to single stranded • Detect difference between a single base pair change.
High Resolution Melt Specifications • Instrument requires: • high-intensity + high sensitivity optics • high-speed data capture • very precise temperature control and resolution • saturating intercalation dye
the world’s only real-time rotary thermo-optical analyser with HRM capabilities
Reaction Chamber Detection Filters Lens PMT Detector Assembly LED Light Source Assembly Tubes Spin inRotor (Red) Spindle/Motor Assembly Cross-section of rotary optics
Note: holes in the rotor allow free airflow Heating mechanism Heater elements switch on Centrifugal fan drives air around chamber Chamber vent seals to contain air
Note: holes in the rotor allow free airflow Cooling mechanism Heater elements switch off Centrifugal fan drives air around chamber Chamber vent opens expelling hot air Centrifugal fan Drives air into chamber Cool air in
Intercalation Chemistries SYBR™ Green I is toxic to PCR,so concentration used is very low Unsaturated binding allows dye to relocate as melting begins Saturating dye technology for HRM -LCGreen™ I, EVA Green, Syto 9 SYBR® Green I Saturation dyes are less toxic,so concentration usedcan be high enough to allow all sites to be saturated Saturation eliminates potential for dye relocation-ideal for HRM LC Green™ I
Setting up a Reaction • Use standard PCR conditions as a starting point, typically 250nM primer, 1.5mM Magnesium chloride, 0.2mM dNTPs, 1.25 U Platinum Taq, 1.5μM SYTO 9, 50ng DNA • Don’t generally usually use real-time mix – decreases cost per assay • Set up cycling and add HRM step at the end • HRM step typically 0.1°C steps over 10 °C, HRM step takes around 20 minutes
0.02deg HRM Profile
Data Acquisition • Melting curves-normalized by selecting linear regions before and after the melting transition • Two regions defined-upper 100% double stranded and lower single stranded baseline
Homoduplexes C or T C G T A Homozygotes represented by a single base change are differentiated by a difference in Tm melt.
Heteroduplex C>T C G T A C A T G + C G T A + + Heterozygotes form heteroduplexes, the heterozygote (blue) trace is a mix of 4 duplexes
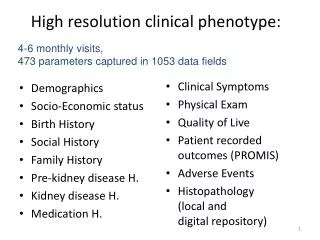
SOFTWARE: Normalised HRM data • ACTN3 • (R577X) (C—T). • 10 replicates. • 40 cycle fast • (~34 min).
Difference Graphs • Difference graph displays the difference between each sample and a given genotype control • Allows a calculated percentage confidence relative to a known genotype
Confidence in HRM Results Wildtype (72 Replicates) Mutant (72 Replicates) Mean Tm 77.90 +0.04% Mean Tm 78.78 +0.04%
Applications • SNP genotyping/ Allelic discrimination • Identify Candidate Predisposition Genes • Association Studies-eg.comparing cases and controls, genotype to phenotype • Prevalence -within population or different sub groups • Loss of Heterozygosity • DNA fingerprinting • Mutation Discovery/Screening/Scanning • Predictive Testing • Penetrance/Linkage studies-variant track with disease within a family • Species Identification
GenotypingClass 4 SNP SNP classes as described by Venter et al 2002 Example of a class 4 SNP on the Rotor Gene (MCT A1470T) The rarest and most difficult SNP to discriminate.
“Spiking” Experiments Homozygous A (dark blue) Homozygous B (Green) Royal Melbourne Hospital
Tm Comparisons-Factor V G1691A 63bp tctgaaaggttacttcaaggacaaaatacctgtattccTtgcctgtccagggatctgctctta 89bp ggttacttcaaggacaaaatacctgtattccTtgcctgtccagggatctgctcttacagattagaagtagtcctattagcccagaggcg 169bp ttgaaggaaatgccccattatttagccaggagacctaacatgttctagccagaagaaattctcagaatttctgaaaggttacttcaaggac aaaatacctgattccTtgcctgtccagggatctgctcttacagattagaagtagtcctattagcccagaggcgatgt
Sensitivity-Somatic Mutation Discovery 189 bp product 37% GC content wt ? Detect small quantities of mutant DNA in a background of wildtype DNA species-sensitivity 5% No homozygous spiking necessary PMCI-Melbourne
Sequencing –Somatic variants Sequence directly of the product-product column purified and not consumed Forward 3’ Reverse 5’ Patient 18 38 G>A Patient 13 35 G>T Patient 6 34 G>T wt Patient 22 35 G>T
Difference Graph wt 35 G>T 35 G>C 35 G>T 34 G>T 38 G>A 38 G>A
White et al. 2006 report http://www.ngrl.org.uk/Wessex/downloads.htm
DNAquality-Multiplex 100, 200, 300, 400 and 600pb product Amplification of 193bp product DNA Quality
Poor Quality DNA in = poor results out! Important to view your data Real Time to check DNA quality Guidleines:Assess the CT values - integrity of your DNA Assess the amplification efficiency Assess the derivative plot melt curves-is there one product? Is the PCR optimized? Primer-dimer issues? Using the Real Time dataallows you to make OBJECTIVE decisions about the changes observed
Applications • Detect small quantities of mutant DNA in background of wildtype DNA species • Important in somatically acquired mutations • Pooling samples-up to 10 samples • Simple for diseases that cause no heterogeneity-like Factor V Leiden, haemochromotosis, sickle cell anemia • Newly identified genes-little information
Summary • Simple, fast, cost effective method for gene scanning and detecting a single-base change in your sample • Rapid cycle PCR with HRM analysis set up at one time • NO labeled probes, cheap intercalation dye • NO Post-PCR processing with additional reagents such as sequencing, DHPLC, RFLP • Excellent sensitivity and specificity - capable of detecting BOTH heterozygous and homozygous changes • Costs less than competing technologies • Sequence directly off the product- sample not consumed • Detect from a pool of 10 samples -1/20 alleles, 5% sensitivity • Auto call software • Scanning and genotyping can be performed simultaneously in the same reaction
Offices Brisbane Australia Corbett Robotics Pty Ltd 42 McKechnie Drive Eight Mile Plains, QLD 4113 T +61 7 3841 7077 F +61 7 3841 6077 United Kingdom Corbett Research UK Limited Unit 296 Cambridge Science Park Milton, Cambridge CB4 0WD T +44 (0)1223 424 288 F +44 (0)1223 424 144 Sydney Australia Corbett Research Pty Ltd 14 Hilly Street Mortlake, NSW 2137 T +61 2 9736 1320 F +61 2 9736 1364 USA Corbett Robotics Inc 185 Berry Street, Suite 5200 San Francisco, CA 94107 USA T +1 415 348 1166 F +1 415 348 1177 E-mail info@corbettlifescience.com Web www.corbettlifescience.com All slides 2006 Corbett Life Science. All rights reserved