Download
1 / 3
30 likes | 168 Vues
Heal th & Sa f e t y R e por t. D e c e m b e r 2 013. 3. A cci d e n t S t a t is t ics 2013 All Acci d e n t s - Y TD D u x fo rd I mmi n g h am S t i r l ing T r e f o r e s t Bir m in g h a m W a r r in gt on New c a s tle H o r s ham Other. 0. 1. 2. 3 2011 2012. 4. 5. 6.

E N D
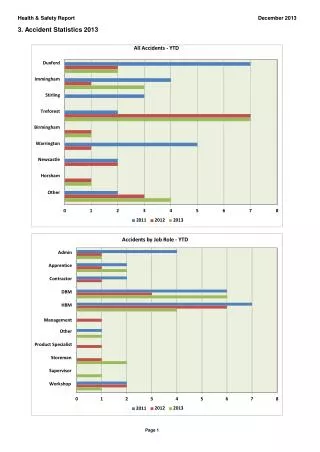
Health &SafetyReport December2013 3.AccidentStatistics 2013 AllAccidents- YTD Duxford Immingham Stirling Treforest Birmingham Warrington Newcastle Horsham Other 0 1 2 3 2011 2012 4 5 6 7 8 2013 AccidentsbyJob Role - YTD Admin Apprentice Contractor DBM HBM Management Other Product Specialist Storeman Supervisor Workshop 2 3 7 8 0 1 4 2012 2013 5 6 2011
Health &SafetyReport December2013 3.Accident Statistics(Continued) Accident Causes - YTD Contact with Hot Object Crush Cut By Fall Hand Tools Manual Handling Other Slip/Trip StruckbyMoving Object StruckFixed Object 0 1 2 3 4 5 2011 2012 2013 6 7 8 9 10 Part of BodyInjured - YTD Ankle Arm Back Eye Foot Hand Head Knee Leg Shoulder Wrist 0 2 4 6 8 10 12 2011 2012 2013
Health &SafetyReport December2013 3.Accident Statistics(Continued) EngineerRevenueLost - YTD Duxford Immingham Stirling Treforest BirminghamWarrington Newcastle Horsham 0 2000 4000 6000 8000 10000 12000 14000 16000 2011 2012 2013