Download
1 / 41
410 likes | 547 Vues
Stratospheric Temperature Variations and Trends: Recent Radiosonde Results. Dian Seidel, Melissa Free NOAA Air Resources Laboratory Silver Spring, MD SPARC Temperature Trends Workshop University of Reading, 3-4 March 2005. Topics. New Radiosonde Datasets Comparison of Stratospheric Trends

E N D
Stratospheric Temperature Variations and Trends:Recent Radiosonde Results Dian Seidel, Melissa Free NOAA Air Resources Laboratory Silver Spring, MD SPARC Temperature Trends Workshop University of Reading, 3-4 March 2005
Topics • New Radiosonde Datasets • Comparison of Stratospheric Trends • Evaluation of Sources of Differences • Linear Trends and Other Models • Upper-Air Measurement Requirements for Climate (time permitting)
Topics • New Radiosonde Datasets • Comparison of Stratospheric Trends • Evaluation of Sources of Differences • Linear Trends and Other Models • Upper-Air Measurement Requirements for Climate
NOAA Datasets • CARDS became IGRA (Imke Durre, Russ Vose, NCDC) • Integrated Global Radiosonde Archive of quality controlled (not homogeneity-adjusted) soundings • Metadata update is ongoing • Angell (2003) reduced network from 63 to 54 stations • Lanzante-Klein-Seidel (2003a,b) adjusted for inhomogeneities • Adjustments based on station history metadata, statistical change-point identification, and evaluation of real abrupt changes • 87 stations, 1948-1997
NOAA Datasets (cont.) • LKS updated for RATPAC • Radiosonde Atmospheric Temperature Products for Assessing Climate • Joint ARL/GFDL/NCDC effort • 16 levels, surface -10 hPa • Climate monitoring data product • Two basic datasets: • Large-scale anomaly time series based on LKS adjustments through 1979 and first-difference method and metadata • Station data with no adjustments post-1979 • General distribution after peer-review
Met Office Datasets • HadRT (Parker et al. 1997) • Based on monthly-mean CLIMAT reports • 444 stations used to create gridded product • Referenced to MSU in stratosphere • HadAT (Peter Thorne et al.) • >600 stations using to create several gridded products • Homogenized using LKS results and neighborhood checks, with focus on troposphere • Includes analysis of uncertainty • 9 levels, 850-30 hPa • GCOS Upper-Air Network Monitoring Center (Mark McCarthy)
Rest of the World • All-Russian Research Institute of Hydrometeorological Information (Alex Sterin) • Ongoing analysis of global and regional data • Other efforts ???
Topics • New Radiosonde Datasets • Comparison of Stratospheric Trends • Evaluation of Sources of Differences • Linear Trends and Other Models • Upper-Air Measurement Requirements for Climate
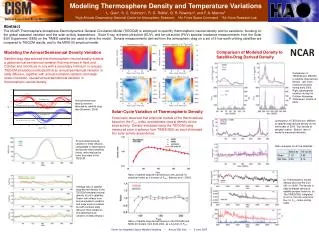
Signals of large-scale, short-lived stratospheric variations in different datasets are in good agreement
Trends from Sondes, MSU & Reanalyses • Large confidence intervals, but these do not address all sources of trend uncertainty • More disparity among datasets than for shorter-term signals • Reanalyses are outliers and are not reliable for trends • Stratospheric cooling is stronger than tropospheric warming, but not more consistently estimated • Sondes show more cooling than MSU • Conventional wisdom is that sonde trends are too strong, but this is not firmly established.
Topics • New Radiosonde Datasets • Comparison of Stratospheric Trends • Evaluation of Sources of Differences • Linear Trends and Other Models • Upper-Air Measurement Requirements for Climate
Comparing Effects of 3 Factors to Evaluate HadRT / LKS Trend Differences • Data Adjustments – compare trends from adjusted and unadjusted data (see above) • Spatial and temporal sampling – compare trends from subsampled datasets and complete datasets, using MSU and reanalysis as complete datasets • Source radiosonde data – compare trends from 71 common stations
Spatial sampling differences 71 stations in common
HadRT and LKS trends agree better at 71 common stations than for full networks
Subsampling MSU makes little difference to MSU/sonde discrepancy (ADJ) (time sampling at month-to-month level only)
3 factors have comparable effects on global trend differences, with adjustments dominating in the stratosphere
Topics • New Radiosonde Datasets • Comparison of Stratospheric Trends • Evaluation of Sources of Differences • Linear Trends and Other Models • Upper-Air Measurement Requirements for Climate
Alternative models may provide better fits (Seidel and Lanzante, 2004) • Models evaluated using Bayesian Information Criterion • Net stratospheric temperature change depends on model selected • Linear -1.13 K • Sloped steps -0.88 K • Censored, flat steps -0.83 • Censored, linear -0.99 • Different models suggest different physical interpretations
Topics • New Radiosonde Datasets • Comparison of Stratospheric Trends • Evaluation of Sources of Differences • Linear Trends and Other Models • Upper-Air MeasurementRequirements for Climate
Issues Affecting Climate Statistics and Trends • Measurement Precision • Sampling Frequency • Number of observations/day • Number of observations/month • Long-term measurement stability • Network size • Locations of network stations
Tests with NCEP Reanalysis Data • Start with 6-hourly data, at 6 pressure levels, at 15 locations, for 1948-2003 • Subsample, or introduce artificial changes • Compare with unaltered data • Monthly means and variances • Multi-decadal trends
Precision Effects on Monthly MeansMeans are within 0.05K for precision <0.5 K
Reduced Diurnal Sampling: • Effect varies with size and shape of diurnal cycle • Going from 4 to 2 obs/day makes significant change in monthly means in only 2.3% of cases (mainly near surface and in stratosphere) • For only 1/day, means change in 13-17% of cases • Conclusion: 2 obs/day may be enough
Number of Observations Per Month • Observations every other day give • monthly means accurate to within 2 K or better • trends that are not statistically different in 90% of cases
Effects of Data Stability on Trends - 1 event Reliable trend estimates require measurement stability within 0.5 K over 20-50 years.
Effects of multiple changes = More errors But the first event causes most of the error
Spatial sampling errors in trends from hypothetical networks from reanalysis– decrease with increasing size 50 200 500 850 Error = trend in subsampled minus trend in complete network
Spatial sampling errors in trends from actual radiosonde networks using reanalysis- no decrease with increasing size 50 200 500 850
Take-Away Points • New Radiosonde Datasets – several, unpublished • Comparison of Stratospheric Trends – increasing cooling with height, with large uncertainties • Evaluation of Sources of Differences – everything matters, but especially homogeneity adjustments in the stratosphere • Linear Trends and Other Models – reasonable to consider nonmonotonic changes • Upper-Air Measurement Requirements for Climate – input from this group would be very welcome!
Take-Away Points • New Radiosonde Datasets – several, unpublished • Comparison of Stratospheric Trends – increasing cooling with height, with large uncertainties • Evaluation of Sources of Differences – everything matters, but especially homogeneity adjustments in the stratosphere • Linear Trends and Other Models – reasonable to consider nonmonotonic changes • Upper-Air Measurement Requirements for Climate – input from this group would be very welcome!
Take-Away Points • New Radiosonde Datasets – several, unpublished • Comparison of Stratospheric Trends – increasing cooling with height, with large uncertainties • Evaluation of Sources of Differences – everything matters, but especially homogeneity adjustments in the stratosphere • Linear Trends and Other Models – reasonable to consider nonmonotonic changes • Upper-Air Measurement Requirements for Climate – input from this group would be very welcome!
Take-Away Points • New Radiosonde Datasets – several, unpublished • Comparison of Stratospheric Trends – increasing cooling with height, with large uncertainties • Evaluation of Sources of Differences – everything matters, but especially homogeneity adjustments in the stratosphere • Linear Trends and Other Models – reasonable to consider nonmonotonic changes • Upper-Air Measurement Requirements for Climate – input from this group would be very welcome!
Take-Away Points • New Radiosonde Datasets – several, unpublished • Comparison of Stratospheric Trends – increasing cooling with height, with large uncertainties • Evaluation of Sources of Differences – everything matters, but especially homogeneity adjustments in the stratosphere • Linear Trends and Other Models – reasonable to consider nonmonotonic changes • Upper-Air Measurement Requirements for Climate – input from this group would be very welcome!