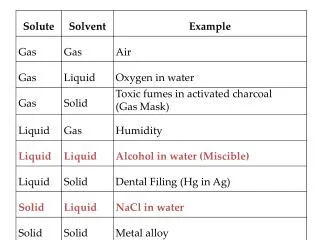
Understanding Radiosondes and Temperature Sounding in Atmospheric Remote Sensing
This article explores the principles of radiosonde data and temperature sounding in the context of atmospheric remote sensing, specifically focusing on water vapor absorption and its implications. It discusses the variability of atmospheric conditions and how path radiance is influenced by temperature and water vapor distribution. Utilizing resources from GOES imagery, this guide provides insights into identifying weighting functions, temperature distribution profiles, and the role of water vapor in sensing applications, crucial for meteorological analysis.

Understanding Radiosondes and Temperature Sounding in Atmospheric Remote Sensing
E N D
Presentation Transcript
OC3522 - Remote Sensing of the Atmosphere and Ocean - Summer 2001 Water Vapor(read Chapter 6 from Kidder & Vonder Haar)
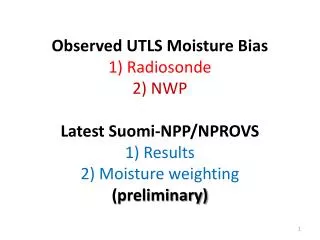
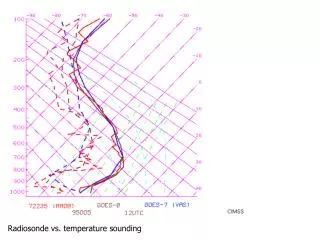
If td(l) is not 0 • We will next look at case where d is relatively large due to water vapor absorption • Again, the atmosphere (path radiance) dominates • Also the source of path radiance will vary stronglywithl ,temperature, and the distribution of water vapor(since water vapor is highly variable vertically and horizontally) • Now... water vapor information Known temperature distribution and
One wavelength, two concentration profiles p rH2O 0 0 d(l,p) 0 0 1 td(l,p) 1 td(l) 0 l
GOES Imager Channel 3 GOES Imager Channel 3 1 transmittance 0 http://zeta.lerc.nasa.gov/goes/mosaic/PROFINFO.HTM
http://cimss.ssec.wisc.edu/goes/misc/wv/weighting_functions3.gifhttp://cimss.ssec.wisc.edu/goes/misc/wv/weighting_functions3.gif GOES Imager Channel 3 Where would CH 12 weighting function peak? (given a standard distributionof water vapor) p CH 11 CH 10
Mid Level (7mm) Low level 7.5mm 16 February 2000 | Mid-latitude Cyclone Over the North Pacific GOES-10 Sounder Water Vapor Channel Images at 17:24 UTC High level 6.5 mm
Water Vapor Imagery Tutorial from Wisconsin Water Vapor Loop
GMS+GOES 20 August 2001 http://www.etl.noaa.gov/satres/realtime.html