Download
1 / 45
460 likes | 690 Vues
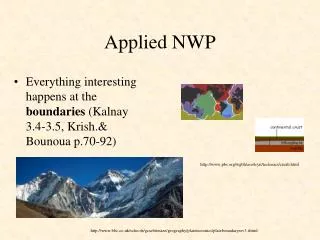
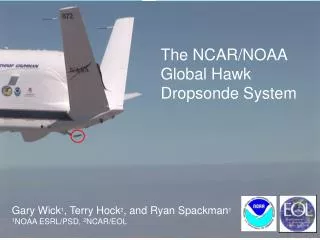
Observed UTLS Moisture Bias 1) Radiosonde 2) NWP Latest Suomi -NPP/NPROVS 1) Results 2) Moisture weighting (preliminary). MetOp -B ATOVS, MIRS, IASI, IASI (EU) GRAS. JPSS-NPP CrIMSS (2) MIRS . NASA-EOS-Aqua AIRS. NOAA-18 ATOVS, MIRS. RADIOSONDE DROPSONDE NWP. FORMOSAT-3, 4

E N D
Observed UTLS Moisture Bias 1) Radiosonde2) NWPLatest Suomi-NPP/NPROVS1) Results2) Moisture weighting(preliminary)
MetOp-B ATOVS, MIRS, IASI, IASI (EU) GRAS JPSS-NPP CrIMSS (2) MIRS NASA-EOS-Aqua AIRS NOAA-18 ATOVS, MIRS RADIOSONDE DROPSONDE NWP FORMOSAT-3,4 COSMIC (UCAR) NOAA-19 ATOVS, MIRS DMSP F-16,17,18 MIRS GOES-11,13,12 IR Soundings MetOp-A ATOVS, MIRS, IASI, IASI (EU) GRAS Yes Plan No NOAA Products Validation System (NPROVS) Schematic
NOAA Products Validation System (NPROVS) Centralized Radiosonde and Collocation Processing NPP Metop-B (dropsonde) 6-hour 250km (UCAR) (11,13 …R) Collocated radiosonde and multiple satellite products dataset NWP: GFS 6-hr CFSR CFSR (Back) Other April 2008 … S i n g l e C l o s e s t
Following slides demonstrate typical differences in UTLS moisture among collocated radiosonde, nwp and satellite data Sources of data are: GRUAN (RS92 vs GFS vs Satellite) … 2011 WMO/CIMO Raob Comparison) (RS92 vs CFH) …. July 2010, S. China NPROVS ( Sondevs GFS vs NPP) … Dec, 2012
… following slides show mean (no weighting) differences between identical RS92 conventional GTS processed sondes(red) vs RS92 GRUAN processed sondes( blue) GRUAN processing include: RH corrections Improved radiation correction Uncertainty etc
ARM • ARM • ARM (1844) Sondes Collocations of GRUAN Sonde and GTS Sonde; 2011 … 70% within circle (50% LIN)
All day Dusk Nite H20 Mixing Ratio (g/kg) % Difference
UTLS Dry bias estimate up to 20% water vapor fraction for conventional vs GRUAN processed sonde during day
Next slide shows H20 vapor fraction differences (no weighting) between concurrent RS92 and CFH and collocated GFS from CIMO S. China radiosondeIntercomparisons, Summer, 2010 RS92 differences from CFH can be upwards 30% too dry in vicinity UTLS and differences from GFS upwards of 50% … tendency for GFS too wet
RS92 COSMIC vs GFS @101 levels RS92 vsCIMO Flight Mean @”101” levels +/- 3 hr • RS92-minus-CFH • @ 101 Lev RS92-minus-CFH @ 42 TOVS Lev brief results from CIMO
… further comparison to NOAA GFS (nwp) show mean “local” differences between sonde and NWP (red) can be 100’s of percent @ UTLS, for example, in vicinity of GRUAN site at Lindenberg (where GRUAN RH uncertainties typically order of a few %) Also shown are NOAA IASI retrievals which show tendency to track the NWP
Lin 500km of Lin Eurasia June 2-9 2012, All conventional sondes, NPROVS
ARM • ARM • ARM (1844) Sondes Collocations of GRUAN Sonde and GTS Sonde; 2011 … 70% within circle (50% LIN)
vs Conv RS92 Mixing Ratio (g/kg) % Difference Mixing Ratio (g/kg) % Difference
Vs Conv RS92 Mixing Ratio (g/kg) % Difference Differences vs GTS processed Raob
TWP Lin
Following 4 slides show: Moisture fraction bias (weighted, Raob) Satellite-minus-Radiosonde: -CrIMSS IDPS -CrIMSS NUCAPS -MiRS Stats shown for common samples with following constraints 1) No Sat QC 2) NUCAPS Passed
No Sat QC vs GFS
NO Sat QC vsRaob
NUCAPS QC vsRaob
NUCAPS QC vs GFS
Perceived characteristic moisture performance varies using NWP vsraob as baseline for comparison, particularly in vicinity of UTLS Moisture from RaobvsNWP diverges above 300 (200)hPa Perceived satellite moisture bias not so dependent on satellite QC CrIMSS“tend” to track NWP moisture more than MiRSin UTLS …
Lindenberg Moisture anomaly persists in latest NPP NPROVS sample ?
Moist NWP signature in vicinity of UTLS, Lindenberg
Some Results for: H20 vapor weighting Perceived H20 performance against RaobvsGFS Impact of Satellite QC
No QC Nucaps QC
Current w: Raob2 …RMS Raob … Mean NUCAPS QC No QC Pending w: Raob … RMS Raob … Mean Standard Deviation vsRaob
w: Raob2 …RMS Raob … Mean NUCAPS QC No QC w: Raob …RMS Raob … Mean SD vs GFS
Examples of IASI, AIRS and GFS “un-weighted” H20 vapor fraction % diff vsraobs April 08 to present … NPROVS/NARCS
Results from “w: raob” approach are pretty close to Results from “un-weighted” approach (NARCS) Results versus NWP favorable for sat validation particularly aloft (UTLS) Redo using new Chris) layers
Next slides quantify differences among: Current ( AIRS, IASI) … w: Raob2(H20) for RMS and Raob(H20) for mean (Mixed) Propose 1 ... w: Raob2(H20) for both RMS and Mean; SD= (RMS2 - Mean2)**.5 Propose 2 … w : Raob(H20) for RMS and Mean; SD as above Using recent NPROVS NPP collocations (December 2012) No SAT QC
Mean Bias w: Raob2 Current w: Raob
RMS Current (w: Raob2) w: Raob
RMS w/QC w/QC
Standard dev Current (mixed) w: Raob2 w: Raob
RH vs % H20 Fraction courtesy Bomin Sun
Monitoring Operational Products from Suomi-NPP usingNOAA Products Validation System (NPROVS) H • NPROVS provides routine inter-comparison of NOAA operational atmospheric sounding products against collocated global radiosondes • Plots show preliminary vertical statistics of satellite-minus-sonde RMS differences for “Test” temperate sounding products from Suomi-NPP which passed internal QC • Left plots show differences for the two suites of “infrared + microwave” based soundings and the right plots the three suites of “microwave only” based sounding currently under development • Although preliminary, results show overall good agreement among the respective products satellites • Results also mark the successful transition of NPROVS from NOAA Satellite Operational Facility (NSOF) to STAR (College Park) computers Significance: Contiguous satellite product validation promotes timely operational deployment of high quality CrIS and ATMS data for weather forecasting and climate
SUMMARY Dry Bias (UTLS) ranges 10 to 30 % in conventional RS92 sondevs corrected GRUAN RS92 Sonde, however differences between corrected GRUAN RS92 sonde and CFH can range 30 to 50% (UTLS). Conversely, moist bias in NWP (GFS) in vicinity of UTLS can be 100’s of % locally made larger by using relatively dry sonde as truth; conversely using nwp as truth decreases perceived magnitude of moist bias Satellite products such as NPP CrIMSS and NUCAPS track nwp moisture whereas MiRS does not … Revised Moisture weighting will “double” the perceived error … NPROVS approaching stable environment for Suomi-NPP Temperature validation