Download
1 / 26
260 likes | 277 Vues
Study evaluates irrigation layouts, scheduling for corn production, strip tillage benefits, and alternative systems in Plovdiv and Genas, France. It also compares different irrigation systems and practices in Lyon-St.Exupery , and Upper Galilee. Results show importance of effective irrigation for cotton and maize yields.

E N D
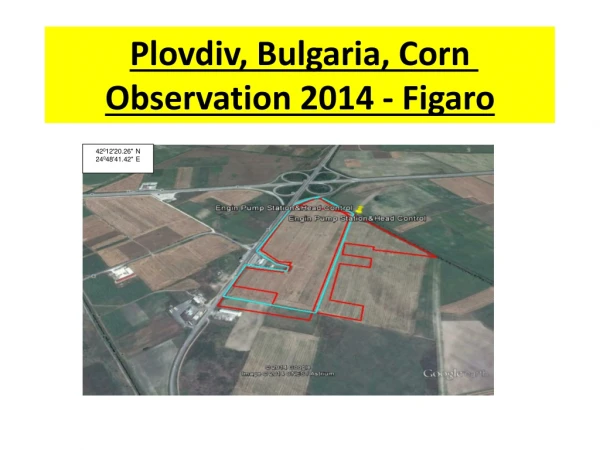
Plovdiv, Bulgaria, Corn Observation 2014 - Figaro 42012'20.26" N 24048'41.42" E
Observation targets: 1. The objective of this study was to evaluate the effect of different irrigation layout (laterals distance) 2. Determination of the irrigation scheduling by crop consumption and soil moisture sensing. 3. Raising Corn as a second crop after wheat, without conventional tillage, using strip tillage as alternative till in order to save energy, and water stored in the soil.
Treatments Precipitation and Evaporation (mm), months 7-10.2014
Plovdiv observation Silage yield (Ton/Ha) Plovdiv observation grain yield (Ton/Ha)
Genas, France, Corn Observation 2014 - Figaro The objective of this study was to evaluate the effect of different irrigation systems: (rain-gun, SDI and surface drip), and to test the implementation of Aqua-crop in maize production
plots (treatments) description Precipitation and Evaporation (mm), months 1-12.2014 (max per day, quantity per month and year accumulation), location: Lyon-St Exupery,
ETo values for 03-12/2014 compare to Average ETo (2002-2013). Water quantity and irrigation interval
Accumulation of GDD for perennial average (average 1981-2010) and 2014
Grain Yield (Ton/Ha), machine harvest Grain Yield (Ton/Ha), manual harvest
The Influence of the Irrigation Regime on Cotton Production in the Upper Galilee The main objectives of this research were to (a) evaluate the response of seed cotton yield to different water regimes; (b) determine the appropriate irrigation practice towards the end of the season.
Treatments: Commercial Irrigation regime (daily irrigation), sharp irrigation reduction after the first open boll appeared. Commercial Irrigation regime (daily irrigation), Moderate irrigation reduction after the first open boll appeared. Stress irrigation regime during the vegetation period, normal irrigation starting with squares appearance, Simulation with Aqua-Crop.
Minimum temperature data for January – September (2012, 2013 and 2014) Maximum temperature data for January – September (2012, 2013 and 2014)
Radiation data for January – September (2012, 2013 and 2014)
Average evaporation (mm/day), Total monthly evaporation (mm), irrigation quantity (mm), irrigation number, crop coefficient
Accumulation of GDD for perennial average (10 years) and 2014.
Quantity and Quality parameters of the cotton Yield GR/L- Quality, LENG- Fiber length, UN- Length Uniformity, STR- strength, EL- Elongation, MIC- Micronaire, Rd- Degree of reflectance,+ b- Yellowness, MAT – Maturity, SFC – Short Fiber Content, MST – Moisture
Commercial irrigation refer to the local custom of the irrigation, Semi-Automation refer to irrigation activation by constant irrigation quantity (determine by ETo*Kc), and monitoring this regime by soil moisture sensors. Irrigation monitoring: Each plot consists of two tensiometers stations, each station with 3 tensiometers: 1. Between two drippers, 0.05 m from the drip lateral (Horizontal, depth 0.3 m. 2. Between two drippers, 0.30 m from the drip lateral (Horizontal), depth 0.3 m. 3. Between two drippers, 0.05 m from the drip lateral (Horizontal, depth 0.6 m. The idea is to monitor the wetted area, with most of the active root zone.