Download
1 / 71
710 likes | 845 Vues
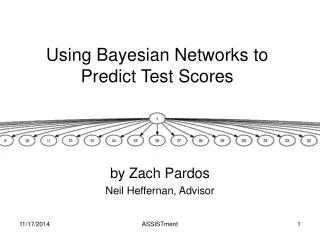
Using CBM to Predict MEAP Reading Test Scores. Our Research Team. Anna Harms. Cristy Coughlin. Patrick Sorrelle. Ed Huth. Christine Russell. Cheyne LeVesseur. Curriculum-based measures for reading provide us with tools to predict performance on high-stakes assessments

E N D
Our Research Team Anna Harms Cristy Coughlin Patrick Sorrelle Ed Huth Christine Russell CheyneLeVesseur
Curriculum-based measures for reading provide us with tools to predict performance on high-stakes assessments We must know how our screening tools and cut scores are designed to function We must use a data-driven process for selecting screening tools and cut scores 3 Big Ideas to Take Away
Purpose of MiBLSi A statewide structure to create capacity for an integrated behavior and academic Multi-Tiered System of Support (MTSS) that can be implemented with fidelity, is sustainable over time and utilizes data-based decision making at all levels of implementation support
Michigan Department of Education/MiBLSi Leadership Provides guidance, visibility, funding, political support for MiBLSi Who is supported? Across State Regional Technical Assistance ISD Cabinet and Implementation Team Provides guidance, visibility, funding, political support, and implementation supports Provides coaching and TA for LEA and/or ISD Teams Multiple ISD/LEA Teams Multiple schools w/in local district Multiple LEAs w/in intermediate district LEA District Cabinet and Implementation Team Provides guidance, visibility, funding, political support, and implementation supports Building Leadership Team Provides guidance and manages implementation All staff Building Staff All students How is support provided? Provides effective practices to support students Students Improved behavior and reading MiBLSi Statewide Structure of Support
2014 New ISDs Previous ISDs Check-In Partnership ISDs
2014 Partnering Districts
A need to accurately respond to requests for recommendations on how to select an appropriate set of benchmark goals and cut points for risk • DIBELS Next, Introduction of the Composite Score • AIMSweb Default Criteria • University of Oregon, Release of an Alternate Set of Benchmark Goals and Cut Points for Risk A desire to “see for ourselves” how well different benchmark goals and cut points for risk function with the MEAP reading test What Led to This Study
A desire to become better consumers of research by learning how to conduct research We did NOT set out to create a new set of benchmark goals and cut points for risk What Led to This Study
Provided initial information during an MTSS Coordinator webinar late Fall 2013 Further invited ISDs partnering with MiBLSi and held follow-up meetings with ISDs that expressed interest Took those who volunteered and were able to successfully export, de-identify, and submit data to MiBLSi by early Winter 2014 Recruitment
Information on Study Sample Number of ISDs, Districts and Students
Information on Study Sample Demographics
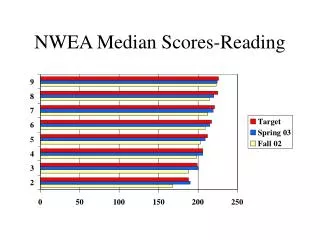
Information on Study Sample 2012 MEAP Reading Results
Information on Study Sample Sample Size Ranges by Grade
This presentation will not provide detailed background information about: MTSS Universal Screening DIBELS Next AIMSweb MEAP We are assuming that you have familiarity with these topics or have a way to deepen your knowledge outside of this presentation. Assumptions
MEAP is a standards-based test that measures how well Michigan students in 3rd through 9th grade are achieving Includes tests in reading, writing, math, science and social studies Reward, Focus and Priority schools are chosen based on MEAP results MEAP is the measuring stick for “Adequate Yearly Progress” Parents utilize MEAP results as a standard for school success In Michigan MEAP is Important
What if we didn’t have to wait and see how students do on the MEAP? What if we could quickly and accurately predict a student’s future reading performance?
Good news, we have universal screening tools to help us!
4.9 With substantial instructional intervention 3.2 Intervention Control With research-based core but without extra instructional intervention Early Intervention Changes Reading Outcomes 5.2 5 4 Low Risk on Early Screening 3 Reading grade level 2.5 2 At Risk on Early Screening 1 1 2 3 4 Grade level corresponding to age Torgesen, 2008
Systematic assessment of all students within a school or district, on academic and/or social-emotional indicators for the purpose of identifying system-wide needs as well as intervention supports Provides information for problem solving at multiple educational levels Identify those who are at-risk for poor performance on other critical measures • Later reading assessments • High-stakes assessment / MEAP Why Universal Screening? LEA District Cabinet and Implementation Team Building Leadership Team Building Staff Students
CBM Correlations with Fall 2012 MEAP Results Universal Screening ConcurrentFall 2012 Universal Screening Previous Fall 2011 Universal Screening Previous Winter 2012 Universal Screening Previous Spring 2012 MEAP Fall 2012
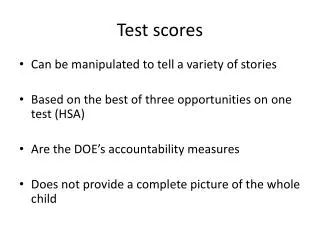
A correlation tells us how two things relate Does not tell us what causes the outcomes When two variables correlate well, we can predict results on one based on the other Why Would a Correlation Be Helpful?
When is a correlation meaningful? Hopkins, 2002
CBM Correlations with Fall 2012 MEAP Results Concurrent Assessments Universal Screening ConcurrentFall 2012 Universal Screening Previous Fall 2011 Universal Screening Previous Winter 2012 Universal Screening Previous Spring 2012 MEAP Fall 2012
Large = Moderate = CBM to MEAP Correlations Concurrent Fall 2012 DIBELS Next AIMSweb
DIBELS Next Correlations with 4thGrade Fall 2012 MEAP Results Universal Screening 4th Grade Fall 2012 Universal Screening 3rd Grade Fall 2011 Universal Screening 3rd Grade Winter 2012 Universal Screening 3rd Grade Spring 2012 MEAP 4th Grade Fall 2012
Large = Moderate = DIBELS Next Correlations with 4th Grade Fall 2012 MEAP Results
When a classroom of students are screened in reading We’ve CBMed…Now What? Some students will be at significant risk Some students will be at risk Some students will be on track
At Risk for later low reading performance How do we know if this prediction is accurate? • AUC • Sensitivity • Odds / Conditional Percentages At Risk For…
The probability a screening test will correctly classify a pair of students from two different categories (at-risk, not at-risk) A measure of a test’s overall diagnostic accuracy (e.g., rapid strep throat test) Area Under the Curve (AUC)
Range across all assessment times within the study: AUC Range Diagnostic accuracy of DIBELS Next and AIMSweb to MEAP
Predict later performance on high-stakes reading assessments • Nearly all correlations between CBM Reading and MEAP fall in the moderate to large categories • Majority of AUC values are at or above .80 • DIBELS Next and aimsweb are efficient assessments that allow us to predict with some accuracy up to a year in advance CBM Reading Assessments
We must know how our screening tools and cut scores are designed to function
Benchmark Goals and Cut Points for Risk Influence Our Decisions Example A: Fall ORF benchmark =70wcpm Example B: Fall ORF benchmark = 97 wcpm
We cannot let any student who might be at risk slip through the cracks We want an accurate picture without overwhelming our resources to provide intervention Methods for Establishing Benchmark Goals and Cut Points for Risk
Classification Accuracy Sensitivity Specificity
If we don’t want to miss any students who might be at risk… …then we may favor the sensitivity statistic when setting goals and cut points for risk Sensitivity: Proportion of students correctly classified at-risk / nonproficient on both the screening and another critical assessment Sensitivity
Decision rule for establishing the benchmark goal: Sensitivity of .90 or higher Example: University of Oregon Center on Teaching and Learning Cutpoints
Quickly identify students that are likely to need additional support to prevent later academic difficulty. DMG Development of Benchmark Goals and Cut Points for Risk:
Did not focus on one single rule or standard. Primary consideration: Odds a student has of meeting a future reading goal based on their DIBELS Next score. Secondary consideration: Marginal percentsand logistic regression. DMG Development of Benchmark Goals and Cut Points for Risk: