Download
1 / 22
300 likes | 813 Vues
Georeferencing images and scanned maps Basics. Prepared by:. George McLeod. With support from:. NSF DUE-0903270. in partnership with:. Geospatial Technician Education Through Virginia’s Community Colleges (GTEVCC). Georeferencing. Georeference

E N D
Georeferencing images and scanned mapsBasics Prepared by: George McLeod With support from: NSF DUE-0903270 in partnership with: Geospatial Technician Education Through Virginia’s Community Colleges (GTEVCC)
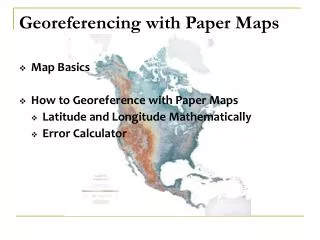
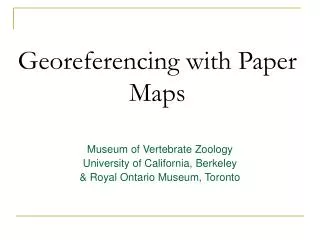
Georeferencing • Georeference • The process of defining how raster is situated in map coordinates. Georeferencing raster data allows it to be viewed, queried, and analyzed with other geographic data.
Scanned Maps and Images • Scanned map datasets don't normally contain spatial reference information. To use some raster datasets in conjunction with your other spatial data, you may need to align, or georeference, to a map coordinate system. • When you georeference your raster dataset, you define its location using map coordinates and assign a coordinate system. Georeferencing raster data allows it to be viewed, queried, and analyzed with other geographic data.
ArcGISGeoreferencing Steps The general steps for georeferencing a raster dataset are: • Add the raster dataset that you want to align with your projected data in ArcMap. • Add control points that link known raster dataset positions to known positions in map coordinates. • Save the georeferencing information when you’re satisfied with the alignment (also referred to as registration). • Optionally, permanently transform the raster dataset.
Control Points • Links that define common points in each coordinate system. • The corners of a map are very often used • A USGS 7.5 minute quad has 16 tic marks that can be used to georeference a map • Control points should be distributed over the area of interest .
Control Points • Generally, you will georeference your raster dataset using existing spatial data (target data), such as a vector feature class, that resides in the desired map coordinate system. The process involves identifying a series of ground control points—known x,y coordinates—that link locations on the raster dataset with locations in the spatially referenced data (target data).
Control Points • The control points are used to build a polynomial transformation that will convert the raster dataset from its existing location to the spatially correct location. The connection between one control point on the raster dataset (the from point) and the corresponding control point on the aligned target data (the to point) is a link.
Control ‘Links’ • If possible, you should spread out the links over the entire raster dataset rather than concentrating them in one area. Typically, having at least one link near each corner of the raster dataset and a few throughout the interior produces the best results.
Georeferencing Process • Create Links • Look at the link table for acceptable RMS on each Point. • Remove links with error that is too high • It is better to keep a link that you are sure is correct. If a link has a high RMS but is correctly located on the image removing it will improve the reported RMS but add error to the map. • Select the order of transformation • Rectify the map selecting the resample method
Geometric Transformation • Geometric transformation is the process of converting a digital map from one coordinate system to another by using a set of control points and transformation equations. • There are several types of transformations, we will make use of the first order polynomial transformation
Transformation • When you've created enough links, you can transform—or warp—the raster dataset to permanently match the map coordinates of the target data. You have the choice of using a polynomial, spline, or adjust transformation to determine the correct map coordinate location for each cell in the raster.
First Order Polynomial Transformation • Affine transformation • x’ = Ax + By + C y’ = Dx + Ey + F • A = Sxcos(t) • B = Sy[k cos(t) –sin(t)] • D = Sxsin(t) • E = Sy[k sin(t) + cos(t)] • C = Translation in x direction • F = Translation in y direction • k =sheer factor Skew angle = arctan(k) • Sx = Scale factor in x direction • Sy = Scale factor in y direction
Georeferencing Images Images - The absolute position of a pixel is defined by its relative position within the whole set. Knowing the position of a single pixel, its shape, its size and the number of pixels in a column, is enough to compute the absolute position of any pixels. Georeferencing modifies the shape of the original pixels. It is thus necessary to perform a process of re-sampling to recover an output image.
Georeferencing Images Image distortions can result from different factors. In the case of aerial pictures or satellite images, the distortions can result from the following factors: • the photograph optics • the atmospheric conditions • the camera position • the ground topography For the scanned documents : • the quality of the scan (distortions on the sides) • the paper deformation • the projection on a flat surface (if it is unknown)
Image Resamplingduringgeoreferencing Re-sampling : calculation of the output pixel values, based on the input image values: • the nearest neighbour • average based on the neighbours • bilinear or bicubic calculation based on the neighbours
Issues to consider when georeferencing scanned maps and aerial photos:Choice of projection: determines the quality of the result. If you choose a map projection that is similar to that used by your scanned map, your georeferenced map may fit nearly perfectly with the control map with only a few control points. Choice of a control map: Georeferencing project is largely dependent on the quality of your control layer. if the scanned map or the control map have spatial errors, then your fit will not be very good. SO try to find the best control layer that you can. Georeferencing with aerial photos: Unrectified Aerial photos are not maps. That is, their scale is not consistent. Hills, and distance from the center of the photo can cause different parts of the map to be distorted different ways. Even though the top of buildings may be the easiest things to see in a photo, try to pick your control points from the ground. GeoreferencingOrthophotos: Most modern airphotos are Ortho-Rectified, which means that they have had distortions removed. Often the displacement of buildings as discussed above can be a factor, but if you are careful to pick your control points from the ground, you can get these to fit well.
Saving GeoreferencingResults in ArcGIS • Update Georeferencing • Adds world file only, which contains transformation parameters for rasters • Image file unchanged • Rectify • Rewrites image file • Use if need to do spatial analysis on file, in which case choose GRID as output type • New square output cells created, so issue arises how the raster values are assigned from input to output cells since the source will have been “warped” • Nearest neighbortakes the value from the cell closest to the transformed cell. It’s the fastest. Should always be used for categorical data since it preserves original values (a 3 will never become 3.25). • Bilinear interpolation takes average of values for four nearest cells in the untransformed data weighted by distance to the transformed cell location. Use only for continuous data such as elevation, slope. • Bilinear smooths data like a low pass filter. • Cubic convolutiontakes average of values for 16 nearest cells in the untransformed data weighted by distance to the transformed cell location. Again, use only for continuous data. Commonly used for photographs and similar data. • Cubic tends to sharpen data like a high pass filter.
ArcGIS Desktop Help contains a wealth of additional information regarding transformation and resampling parameters.