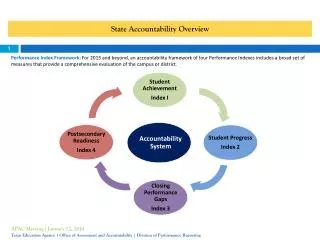
Overview of State and Federal Accountability Indicators
Overview of State and Federal Accountability Indicators. September 2019 Please mute your phone or microphone. The webinar will begin shortly. Using AdobeConnect. Please type your questions in the Q&A box in the lower right hand corner of your screen. Topics for Today’s Webinar.

Overview of State and Federal Accountability Indicators
E N D
Presentation Transcript
Overview of State and Federal Accountability Indicators September 2019 Please mute your phone or microphone. The webinar will begin shortly.
Using AdobeConnect Please type your questions in the Q&A box in the lower right hand corner of your screen.
Topics for Today’s Webinar • State Accreditation • Indicator definitions and calculations • Available reports in SSWS • Frequently asked questions from school divisions • What to expect for 2020-2021 • Federal Accountability • Indicator definitions and calculations • Long-term goals and interim measures of progress • How indicators are used to identify schools for support and improvement
For More Information • Calculating Accreditation – available in the Instructions link of the Accreditation 2017 Revised SOA application • Calculating ESSA – available in the Instructions link of the Federal Accountability Application (ESSA) application
Big Picture: State and Federal Accountability State Accreditation Federal Accountability Based on Every Student Succeeds Act with USED-approved state plan Subset of schools identified for improvement based on indicators’ annual targets • Based on Board-approved Standards of Accreditation (2017 Revision) • All schools receive a rating based on performance of indicators against a benchmark
Big Picture: State and Federal Accountability State Accreditation Federal Accountability Pass rates, student growth, and EL progress are three separate metrics Graduation indicator is 4-year FGI No Safe Harbor allowed • Combined rate includes passing tests, growth, and EL progress • Graduation indicator is GCI • Incentive for improvement on indicators
Big Picture: State and Federal Accountability State Accreditation Federal Accountability Small n is 30, with the 3-yr rate excluded if the current year is too small Participation calculations required • Small n is 30, with well-performing smaller student groups considered • No participation calculations
Big Picture: State and Federal Accountability State Accreditation Federal Accountability For Grades 3-8, any test taken during the Summer, Fall and Spring For Grades 9-12, the FGI cohort minus dropouts, LTA SOL and VAAP test takers Substitute tests are only for math and only AP, IB, SAT and ACT • Includes any tests taken during the Summer, Fall and Spring • SOL, VAAP and substitute test takers (any Board approved test, all subjects)
Public Reporting of Assessment Data • Annual Pass Rates (Build-a-Table) • Passing tests / total tested • Some exclusions, including failing retests and substitute tests • ESSA Pass Rates • Annual rate for grades 3-8 and cohort rate for high school • Denominator is higher of two calculations • Specific rules for late transfer students and AP, IB, ACT, or SAT substitute tests • Accreditation Combined Rates • Students who pass state assessments, OR • Students who fail state assessments but show growth in reading or mathematics (grades 4-8), OR • For English only, students who fail state assessments and do not show growth but show progress towards proficiency as an English Learner (grade 3-proficiency)
English Learner Students • Annual pass rates: • Beginning in 2018-2019, Formerly Limited English Proficient Students (FLEPs) are excluded from the English Learner reporting group • ESSA pass rates: • Formerly Limited English Proficient (FLEP) students are counted in the EL student group if the student passes the state assessment • Accreditation combined rates: • EL students with an SOA adjustment flag who fail but show growth or progress are counted in the combined rate • Formerly Limited English Proficient (FLEP) students are counted in the EL student group if the student passes the state assessment or fails the state assessment but shows growth
State Accreditation: Academic Achievement • Indicators: • English (reading and writing) • Mathematics • Science • Achievement gaps in English • Achievement gaps in mathematics
Achievement Gaps • Calculated for both English and mathematics using the same rules for the all students combined rate • Based on the following student groups: • Asian students • Black students • Economically disadvantaged students • English learners • Hispanic students • Students with disabilities (excludes 504 students) • White students
State Accreditation: School Quality and Progress • Chronic Absenteeism • Dropout Rate • Graduation and Completion Index • College, Career, and Civic Readiness Indicator
State Accreditation Indicators • Changes and clarifications • Tests included and excluded in the academic indicator calculations • Use of MSC as data source for College, Career, and Civic Readiness Indicator
Academic Indicators • Excluded from accreditation calculations: • Board-approved substitute tests in mathematics (i.e., SAT, ACT, AP, and IB tests) submitted to meet federal accountability requirements in high school for students who have passed the Algebra I SOL test and attempted the Geometry, and Algebra II tests prior to 9thgrade
College, Career & Civic Readiness Indicator • Total unduplicated count of students who successfully completed AP, IB, Cambridge, or dual enrollment courses • Using Master Schedule Collection to verify enrollment and credit awarded • Added Cambridge participation from the Student Record Collection • Total unduplicated count of students who earned two or more standard credits for state-approved courses in a CTE program (CTE finisher) and also earned a CTE credential • Calculation updated to capture CTE finishers instead of completers
Reports Available in SSWS • *Accreditation Detail Report - provides school accreditation ratings and school quality indicator-level details which lead to the ratings • Level 3 (4 Years) Watchlist Report - summarizes by school the consecutive years any accreditation indicator has been at Level Two or Level Three • State Accreditation Historical Data Report - uses 2017 SOA formulas to calculate accreditation indicator rates on available data by school beginning with the 2010-2011 school year • Waiver Report - lists the schools which are accredited based on a waiver *Reports are available at the school-level with permission from the division
Reports Available in SSWS • *New: Student Performance Roster Report – provides a by-name list of students and indicates in which student groups the students are considered and how they were counted or why they were excluded from the academic achievement indicators used for accreditation • *New: Chronic Absenteeism Roster Report - provides a by-name list of students and indicates in which student groups the students are considered and how they were counted in or why they were excluded from the chronic absenteeism indicators used for accreditation • *New: Failure Rate Report - calculates current year and previous year failure rate and the reduction in failure rate for all applicable academic achievement indicators by school *Reports are available at the school-level with permission from the division
Frequently Asked Questions • Waivers for Annual Accreditation • Failure Rate Calculations • Rules for Level 3(4YRS) Status
Waivers from Annual Accreditation • Waivers still apply under the revised accreditation system per §22.1-253.13:3 and §22.1-253.13:9 • Schools meeting accreditation benchmarks for three consecutive years are eligible for a waiver • Status under waiver will remain accredited even if school did not meet benchmarks in current year A = Accredited; AWC = Accredited with Conditions
Level Three (4 Years) • Indicators with a status of Level Two or Level Three through four consecutive years will be designated in the fifth year as Level Three (4YRS)
Level Three (4 Years), cont. • The count of consecutive years a school quality indicator has a status of Level Two or Level Three is based on the selected rate, meaning the better of the current year or the cumulative three-year rate when applicable • Schools can exit Level Three (4YRS) status when the indicator reaches Level One or Level One (R10) status
Level Three (4 Years), cont. • 2014-2015 accountability year baseline year: • Academic achievement - English • Academic achievement – Mathematics • Academic achievement – Science • Graduation and Completion Index • 2018-2019 accountability year: • Academic achievement gaps - English • Academic achievement gaps – Mathematics • Dropout rate • Chronic absenteeism • 2022-2023 baseline year for the College, Career, and Civic Readiness Indicator
Failure Rate Calculations • (Students tested - students passing) / students tested • Failure rate includes students who fail but show growth in both the numerator and denominator • Recovery tests are only counted once • Failure rate does not include students who fail the assessment and have an SOA adjustment flag (EL or transfer)
New for 2020-2021 • Multiple Races student group will be added to achievement gap indicators (Superintendent’s Memo #107-19) • VDOE is in the early phases of developing additional accreditation analytics tools for divisions with a proposed July 2020 release • VDOE expanded definition of work-based learning experiences to 11 different types; data collections are updated and decision will be communicated shortly on how the new definition will impact the CCCRI • VDOE’s Director of Accountability (new position) will provide oversight for both state and federal accountability
Identification of Federal Benchmarks ESSA requires long-term goals and interim measures of progress for each indicator:
Academic Achievement Passrates on SOL and VAAP assessments – elementary and middle schools • The numerator of the pass rate includes all passing tests - test results for students enrolled in the school for less than 50 percent of the school year are excluded for students who do not pass. • The denominator of the pass rate includes at least 95 percent of enrolled students in tested grades.
Academic Achievement Passrates on SOL and VAAP assessments – high schools • A twelfth grade cohort rate that incudes assessments taken in grades 9-12 is used to calculate the pass rates. • The numerator of the pass rate includes passing tests - only one score per student per subject will be counted. • In mathematics, Algebra I, or an advanced test for students who pass Algebra I prior to the ninth grade, is included. • Under Virginia’s approved mathematics waiver, certain nationally-recognized substitute tests (AP, IB, SAT, or ACT) are included for students who attempted all EOC mathematics tests prior to grade nine.
Academic Achievement Passrates on SOL and VAAP – high schools • Test results for students enrolled in the school for less than 50 percent of the cohort year are excluded for students who do not pass. • The denominator for the pass rate includes at least 95 percent of students enrolled in the twelfth grade cohort for 50 percent or more of the cohort year. • Students who transfer into Virginia schools after September 30 of their ninth grade year and who do not have an SOL or VAAP assessment are excluded.
Growth for Elementary and Middle Schools Progress Tables (Value Tables) • Test results for students who pass the SOL or the VAAP and students who do not pass but show growth from the previous year are included. • Test results for students enrolled in the school for less than 50 percent of the school year are included for students who pass or show growth from the previous year. • Test results for students who are retained and who take the same grade level SOL test for two consecutive years are not included. • Information on the growth calculations is available on the 2017 SOA: Impact on Schools and Impact on Students webpage .
Graduation Rates • Federal Graduation Indicator (FGI) • Four year rate only (extended year rates not included) • FGI lagged by one year through 2018 • For 2019 and beyond, current year will be used
Progress in English Learners (ELs) Gaining Proficiency in English ACCESS for ELLs 2.0 Assessment • School progress includes ELs in grades K-12. • The minimum n for this indicator is 30 ELs with 2 consecutive years of ACCESS for ELLs 2.0 data in Virginia schools. • Test results for students enrolled in the school for less than 50 percent of the school year are included for students who show progress from the previous year.
School Quality or Student Success Two measures • Chronic Absenteeism • Students enrolled in the school for less than 50 percent of the school year are excluded • Standards of Accreditation (SOA) Rating
Virginia’s Consolidated Application – Year One of Implementation (2018-2019 School Year) • May 2018 – Plan approved (fourth revision) • October 2018 – Amendment #1 approved • Removed “Rank these schools by the rate of chronic absenteeism” from the last step of the identification process for comprehensive support and improvement schools • October 2018 – Identification of schools • Comprehensive Support and Improvement – 39 schools • Additional Targeted Support and Improvement – 39 schools
Year One of Implementation (2018-2019 School Year), continued • June 2019 – Amendment #2 approved • Added definition of ineffective teacher For the purposes of meeting the requirements of this section, the Virginia Board of Education has determined that an ineffective teacher is defined as a teacher who is both out-of-field and inexperienced. • Out-of-field and inexperienced data to be added to Teacher Quality tab of SQPs by September 15, 2019
Year Two of Implementation (2019-2020 School Year) • July 2019 – Amendment #3 submitted • FGI - use the current year’s cohort data • Mathematics targets – revise to reflect statewide data from new SOL mathematics tests • Chronic absenteeism targets - calculate using the same methodology used on other federal indicators • Include 2016-2017 state data on teachers who were out-of-field and inexperienced • Title II, Part A, state level set-aside funds - use to support training and technical assistance to school divisions on upcoming revisions to the teacher evaluation system
Identification of Schools: Comprehensive Support and Improvement • Lowest 5% of Title I schools based on ALL students group • Identified every three years beginning with the 2018-2019 school year • Eligible to exit after two years • Any high school with an FGI below 67% will be identified (eligible to exit after one year)
Identification Process: Comprehensive Support and Improvement • Did not meet the interim measure of progress for chronic absenteeism • andnot • Accredited
Exit Criteria: Comprehensive Support and Improvement • The lowest 5% of Title I schools must, after a minimum of two years: • Demonstrate improved student performance as compared to performance when the school was identified and • No longer be in the bottom five percent of Title I schools based on the performance of all students • Schools that exit this status at the end of year two will be required to implement sustainability plans for at least one additional year • High schools with an FGI below 67% must, after a minimum of one year: • Increase the FGI to 67% or above • Schools that do not meet the exit criteria after three years will receive more rigorous interventions
Identification of Schools: Targeted Support and Improvement • Identification based on student group (subgroup) performance • Title I and non-Title I schools identified annually beginning with the 2019-2020 school year • Eligible to exit after one year
Identification Process: Targeted Support and Improvement Did not meet the interim measure of progress for chronic absenteeism for two consecutive yearsandnot Accredited
Identification of Schools:Additional Targeted Support and Improvement • Identified every three years beginning with the 2018-2019 school year • From among targeted support schools, schools that have one or more subgroups performing at a lower level on all required indicators than the performance of the highest performing comprehensive support and improvement school on each indicator
Exit Criterion: Additional Targeted Support and Improvement • Additional targeted support and improvement schools must, after a minimum of one year: • Meet the interim measure of progress in the subgroup or subgroups for which the school was identified • Title I schools that do not meet the exit criterion after three years will be identified for comprehensive support and improvement
Federal Targets - Mathematics (Proposed) *Subgroups that meet or exceed the target must improve from the previous year.