Download
1 / 18
180 likes | 271 Vues
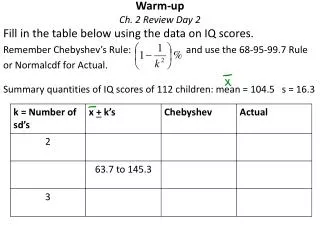
Warm-up Day of Ch. 7 Review. Free Response A h.s . math teacher believes the greater number of hours of sleep before taking an AP exam, the better the score. She interviews the 18 students taking her AP Statistics class the day after the exam and later

E N D
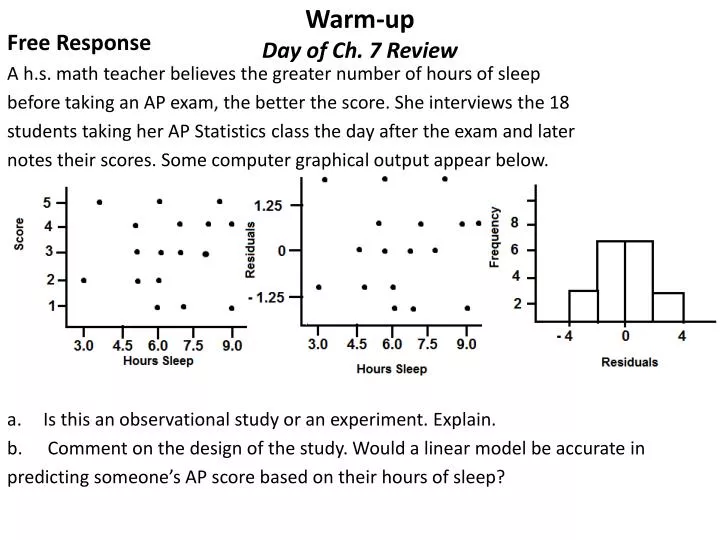
Warm-upDay of Ch. 7 Review Free Response A h.s. math teacher believes the greater number of hours of sleep before taking an AP exam, the better the score. She interviews the 18 students taking her AP Statistics class the day after the exam and later notes their scores. Some computer graphical output appear below. • Is this an observational study or an experiment. Explain. • Comment on the design of the study. Would a linear model be accurate in predicting someone’s AP score based on their hours of sleep?
H.W. Answers to P#17, E #35, 36, and 40 P #17. a. The distribution with the most normal shape was the sample size of 100. Since the proportion is 0.1, this makes expected number of successes 10. This barely passes the np and n(1-p) > 10 criteria. b. I’d expect 1 to pass from 10, 2 from 20 etc… c. The one with the smallest spread is the one with the largest sample size. d. Since the sample size of 10 has the largest spread, it is the most likely of the distributions to have 20% of the drivers to fail.
Textbook Review of Ch. 7 Complete E#49 to 51 and 59 pages 460 to 463; AP 1 -4 pg 464 in the next 40 minutes I need to see the remaining notebooks for the notebook check. Ch. 7 Notebook Check: 1) 7.1 2) 7.2 3) 7.1 and 7.2 Review sheet 4) 7.3 (19 pts each = 76 pts) 7 Terms and Properties ( 3 pts each = 21 pts)
E#49 and 50 a. A sampling distribution of the proportion of rural Chinese people from samples of 200 would have an approximately normal shape. The center will be at the true proportion of 68%. The standard error will be at 0.0329. b. The probability that 75% or more of the sample lives in rural areas is 0.01691. c. Rare events would be those below 61.5% or those above 74.5% d. Expected # living in rural areas is 0.68 (200) = 136 Standard deviation is 6.6. The likelihood that 130 or more in sample are from rural areas is 81.8%________________________________ a. 50 books will have an S.E. of 0.297. A shelf of 240 cm means that each Book has to be 4.8 cm or less. Normalcdf (0, 4.8, 4.7, 0.297) ≈ 0.632 b. No. This might not work for philosophy books, because it is not a random sample of books.
E#51 and 59 a. I find the ages of some of the CEOs disturbing. Anyone over 70 should be retired. b. For a sample of 10 the S.E. is 2.15. So the probability that the average is between 55 and 60 is about 60.48%_______ AP 1. C 2. B 3. D 4. D
Ch. 7 Test preparations • Understand all formulas and when to use them. • Know all terms, properties and conditions. • Go over old homework questions, quiz questions and notes. • Bring your textbook to copy 8.1, 8.2, 9.1 and 9.2 terms after the test.
Warm-up Day of Ch. 7 Test 1. Which of the following are true statements about sampling? I. Careful analysis of a given sample will indicate whether or not it is random. II. Sampling error implies an error, possibly very small but still an error, on the part of the surveyor. III. Data obtained when conducting a census are always more accurate than data obtained from a sample, no matter how careful the design of the sample survey. (A) I only (B) II only (C) III only (D) None of the statements are true. (E) None of the above gives the complete set of true responses. 2. Which of the following statements about residuals are true? I. The mean of the residuals is always zero. II. The regression line for a residual plot is a horizontal line. III. The standard deviation of the residuals gives a measure of how the points in the scatterplot are spread around the regression line. I and II (B) I and III (C) II and III (D) I, II, and III (E) None of the above.
Ch. 7 Test Directions • You can not write on the test. Use the answer sheet. • Read directions carefully. • No calculator talk on the free response. Explain by showing diagrams and work. • When you finish turn in your test, answer sheet and formula sheet. • Homework is to define terms for 8.1, 8.2, 9.1 and 9.2 1)Confidence Interval 2) Tests of signficance3) variation in Sampling 4) statistically significant 5) null hypothesis 6) test Statistic 7) P-value 8) critical value 9) levels of significance 10) degrees of freedom 11)confidence interval of the mean 12) capture rate 13) margin of error 14) t-distribution • Read 8.1