Download
1 / 12
120 likes | 274 Vues
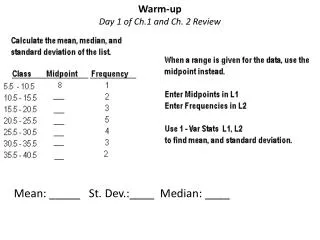
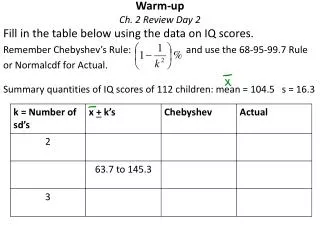
Warm-up Ch. 2 Review Day 2. Fill in the table below using the data on IQ scores. Remember Chebyshev’s Rule: and use the 68-95-99.7 Rule or Normalcdf for Actual. Summary quantities of IQ scores of 112 children: mean = 104.5 s = 16.3.

E N D
Warm-upCh. 2 Review Day 2 Fill in the table below using the data on IQ scores. Remember Chebyshev’s Rule: and use the 68-95-99.7 Rule or Normalcdffor Actual. Summary quantities of IQ scores of 112 children: mean = 104.5 s = 16.3
Answers to Normal Distribution Worksheet #3 • a. 99.8% b. 21.3% • a. 91.4% b. invNorm(0.87, 22.8, 0.65) = 23.53 cm c. invNorm(0.13, 22.8, 0.65) = 22.06 cm d. Middle 74% is 13% to 87% (87-13 = 74) The sardines are between 22.06 and 23.53 cm. 3. a. 42.07% b. 218.8 mg/dL 4. a. 88.3% b. 30.7 mg/dL 5. a. 0.47% b. 24.5 oz c.
Practice Test Directions • Work on the practice test silently BY YOURSELF for 30 minutes. • Working silently for 30 minutes = 100% participation. • Once the 30 minutes are up you may discuss any problems with your table. • Once it appears everyone is almost done reviewing answers I will post the answers on the SmartBoard and I will answer questions.
Directions for #10 Use L1 for first column (data) Use L2 for second column (frequency) [2nd] [LIST] Brings up a menu of listoperations. Position cursor over MATH Brings up a new menu that includes mean and std. dev. [3] Select the mean to be computed. [2nd] [L1] [,] [L2] [)] [ENTER] Indicates L1 is the data listand L2 is the list of Frequencies Then do the same to find standard deviation.
Answers to Practice Test 1) C 2) A 3) Your data set should include a set of numbers where the Q1 and minimum are the same number. 4) a. The mean would increase but the medianwould stay thesame. b. the mean and standard deviation would be 12 x greater.c. the mean would be 10 units greater and the std. dev. would remain the same. 5) A 6) B
Answers to Practice Test continued… 7) 1.5. The z-score reflects it is 1.5 s.d. above the mean. 8) $91583.80 9) C 10) a and b. Mean 2.05 and s.d. 1.028 11) a. creating the box plot mark minimum, 25th percentile is Q1 median is 50th percentile, Q3 is the 75th percentile, and mark the maximum b. A 12) It would be DiMaggio because based on his homeruns given, average, and s.d. his performance would be in the 98th percentile vs. Bonds for his performance in comparison to Bond’s own average and s.d.
H.W. Assignment • H.W. pg 102 and 103 #AP 1 – AP 8 . • Next class is the Ch. 2 Test!!! • You should have already printed out the outline. • You should have also been reviewing terms and reviewing notes and completing practice problems from
Common mistakes on Quiz 3 covering 2.4 and 2.5 2) The hypothetical situation presented of being the principal of a highly regarded technology high school was unrelated to question 1. I accepted either the mean or median, as long as your explanation made sense. The answer key suggested a highly regarded technology school would have higher math scores so the median would be best, because there may be a few low outlier scores that may bring down the mean.
Other common mistake from Quiz 3 6) When combining the normal distributions of male and female heights, the resulting graph is bi-modal. The new mean would be between the two graphs since there is an equal number of males and females. Since, there would be more extreme values, the lowest height for a female and the highest height for a male, the standard deviation would increase. Remember standard deviation describes spread and the data would be further from the mean in general.