Statistics 101
Statistics 101. Tim Poynton Center for School Counseling Outcome Research. Statistics 101. Using data requires an understanding of some basic statistics – nothing too fancy is needed!

Statistics 101
E N D
Presentation Transcript
Statistics 101 Tim Poynton Center for School Counseling Outcome Research
Statistics 101 Using data requires an understanding of some basic statistics – nothing too fancy is needed! Having a handle on some common terms will allow you to make sense of all the numbers and increase your ability to use data
Statistics 101 – Common Terms • N - Number of participants • Mean – the “average” score – all scores are added up and divided by the N • Standard Deviation – how far, on average, a single score deviates from the mean score
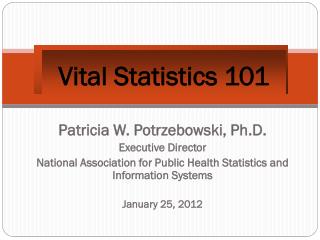
60 50 40 30 20 10 0 55 70 85 100 115 130 145 Score on IQ test Statistics 101 – Common Terms A frequency Histogram can be used to show how people scored on a variable – this is useful for demonstrating how several of these concepts work Number of people
60 50 40 30 20 10 0 55 70 85 100 115 130 145 Score on IQ test Mean = 100, SD = 15 Statistics 101 – Common Terms Number of people
Statistics 101 – Common Terms Number of people 60 50 40 30 20 10 0 55 70 85 100 115 130 145 Score on IQ test Mean = 100, SD = 30
60 50 40 30 20 10 0 55 70 85 100 115 130 145 Score on IQ test Mean = 100, SD = 10 Statistics 101 – Common Terms Number of people
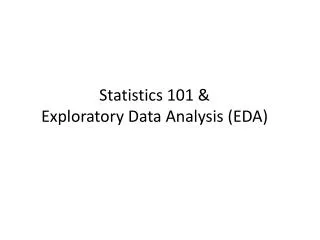
Statistics 101 – Common Terms • Median – the “middle” number. Obtained by putting all the observed values on a line and finding the one that lands in the middle. Useful for describing “skewed” distributions • Mode – the most frequent number
60 50 40 30 20 10 0 55 70 85 100 115 130 145 Score on IQ test Mean = 100, Median = 100, Mode = 100 Statistics 101 – Common Terms Number of people
60 50 40 30 20 10 0 55 70 85 100 115 130 145 Score on IQ test Mean = 100, Median = 90, Mode = 80 Statistics 101 – Common Terms Number of people
60 50 40 30 20 10 0 15 30 45 60 75 90 105 Household Income(in thousands) Mean = 62, Median = 47, Mode = 40 Statistics 101 – Common Terms Number of people
Statistics 101 – Common Terms • Z-Score – a “standardized score”. The person’s mean score divided by the standard deviation • Percentile Rank – tells you the relative position of a person’s score, compared to other people’s scores
Statistics 101 – Common Applications • Categorical Variable – a variable that divides data into groups; has little or no numeric meaning • Dependent Variable – a variable that contains information you are interested in that has numeric value • Disaggregation – sorting a dependent variable by a categorical variable (or variables) • Correlation – a number between -1 and +1 used to describe the relationship between two variables
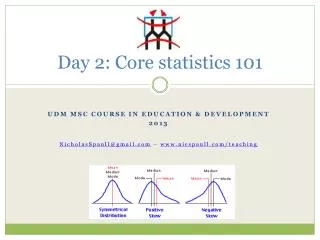
Statistics 101 – Common Applications • T-Tests • one sample – compare a group to a known value • For example, comparing the IQ of convicted felons to the known average of 100) • paired samples – compare one group at two points in time • For example, comparing pretest and posttest scores • independent samples – compare two groups to each other • ANOVA - compare two or more groups, OR, compare at two or more points in time (repeated measures)
60 50 40 30 20 10 0 0 1 2 3 4 5 6 7 8 9 10 11 12 13 14 15 16 17 18 Days Absent Non-significant t-test Statistics 101 – Common Applications Male Female Number of people
60 50 40 30 20 10 0 0 1 2 3 4 5 6 7 8 9 10 11 12 13 14 15 16 17 18 Days Absent Significant t-test Statistics 101 – Common Applications Male Female Number of people
60 50 40 30 20 10 0 0 1 2 3 4 5 6 7 8 9 10 11 12 13 14 15 16 17 18 Days Absent Non-significant t-test (SD’s increased) Statistics 101 – Common Applications Male Female Number of people
Thank You!Center for School Counseling Outcome Researchwww.cscor.org