Download
1 / 19
190 likes | 285 Vues
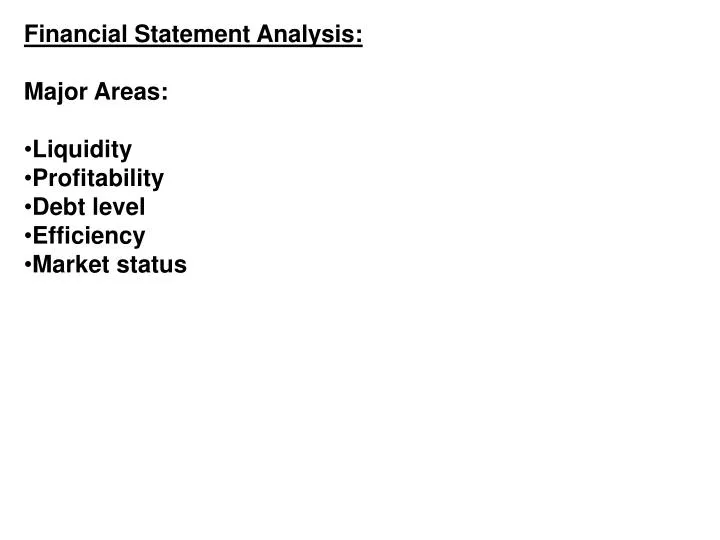
Financial Statement Analysis: Major Areas: Liquidity Profitability Debt level Efficiency Market status. When using ratios to analyze the financial statements of a company it is usual to consider a number of themes: 1: LIQUIDITY:

E N D
Financial Statement Analysis: • Major Areas: • Liquidity • Profitability • Debt level • Efficiency • Market status
When using ratios to analyze the financial statements of a company it is usual to consider a number of themes: 1: LIQUIDITY: Is the company able to pay its immediate debts, or is it going to run out of cash? 2: PROFITABILITY: How well has the company performed in terms of profit and the resources used to earn that profit? 3: DEBT: Does the company have so much debt that it is high risk? 4: EFFICIENCY: How well has the company used its assets to generate sales? 5: MARKET RELATED: What are the earnings and dividends?
Liquidity Analysis: Is the company able to pay its immediate debts, or is it going to run out of cash? Current ratio: Current assets/current liabilities: 20001999 $1,528/$1,125 = 1.36:1 $1,902/$1,441 = 0.96:1 The ratio has increased, but is still below the 2:1 we expect. Quick ratio: (Current assets – inventories)/current liabilities ($1,528 - $412)/$1,125 = 0.99:1 ($1,902 - $473)/$1,441 = 0.99:1 The ratio is constant and acceptably close to 1:1.
2: PROFITABILITY: How well has the company performed in terms of profit and the resources used to earn that profit? Return on sales %: Operating income/sales *100: $335/$5,207 * 100 = 6.4% $324/$4,728 * 100 = 6.9% A low margin business, and declining! Return on assets %: Operating income/total assets * 100: $335/$3,748 * 100 = 8.9% $324/$3,871 * 100 = 8.4% A modest return, but increasing. Return on equity %: Net income/shareholders’ equity * 100: $148/$1,460 * 100 = 10.1% $146/$1,345 * 100 = 10.9% A modest return, and declining!
3: DEBT: Does the company have so much debt that it is high risk? Debt to assets %: Total debt/total assets * 100: $2,288/$3,748 *100 = 61% $2,526/$3,871 * 100 = 65% More than 50% of assets are financed by debt: high risk. Debt to equity %: Total debt/shareholders’ equity * 100: $2,288/$1,460 * 100 = 157% $2,2\526/$1,345 * 100 = 188% Debt is more than 100% of equity: high risk. Interest cover ratio: Net income after tax, but before interest/interest expense: ($148 + $95)/$95 = 2.6 times ($146 + $97)/$97 = 2.5 times Interest expense is adequately covered by net income.
4: EFFICIENCY: How well has the company used its assets to generate sales? Total asset turnover: Sales/total assets: $5,207/$3,748 = 1.39 times $4,728/$3,871 = 1.22 times Slightly more efficient in year 2000. The company can work on its efficiency in two ways: 1: By increasing the sales from the existing level of assets. This means earning their profit margin on sales more frequently. 2: By reducing the assets used to generate the same level of sales. This means an increase in their return on assets %. Opportunities to manage individual assets are shown in the receivables and inventory ratios that follow.
Receivables turnover ratio: Credit sales/receivables: $5,207/$969 = 5.4 times $4,728/$873 = 5.4 times OR: Receivables collection period: Receivables/(credit sales/365): $969/($5,207/365) = 67.9 days $873/($4,728/365) = 67.4 days Receivables are being “turned over” 5.4 times per year, which is equivalent to collection receivables in 67 days on average. Bear in mind that these financial statements are for Canadian Tire the wholesalers, not the retail outlets. Retail branches of Canadian Tire would have much lower receivables collection periods.
Inventory turnover ratio: Cost of goods sold/inventory: $<5,207/$412 = 12.6 times $<4,728/$473 = 10 times OR Inventory holding period: Inventory/(cost of goods sold/365): $412/(<$5,207/365) = 29 days $473/$(<4,728/365) = 39 days The company has become much more efficient in respect of inventory. It is now turned over 12.6 times per year, (i.e. held for less than one month). As long as this did not lead to reduced sales (through being “out of stock”) it represents good management.
Market related ratios: Earnings per share: Net income/number of common shares: $148/79 = $1.87 $146/78 = $1.87 Investors make buy/sell decisions partly on the basis of how many $ of earnings each share is entitled to. This has not changed. Dividend cover ratio: Net income/dividend: $148/$31 = 4.8 times $146/$31 = 4.7 times Dividend payout %: Dividend/net income * 100: $31/$148 * 100 = 20.9% $31/$146 * 100 = 21.2% Investors are also interested in what % of the earnings is paid out as dividends, and what % is ploughed back into the company. This was around 21% payout in both years.
Summary: Canadian Tire is a solid, but unexciting company from this analysis of its financial results for 1999 and 2000. It is low liquidity, but not dangerously so; It has rather too much debt for comfort; It has modest returns on its assets and sales; Efficiency is somewhat improved in 2000 over 2001, mainly due to better management of inventory; It ploughs back almost 80% of earnings into growth through new investment.
Chapter Problem Canadian Tire further example – 2001 Adds one more year for the same company
Canadian Tire: Consolidated Statement of Earnings and Retained Income: $ million, for the Year:2001 Gross operating revenue 5,374 Less: Cost of goods sold & operating expenses: Various 4,874 Depreciation 136 5,010 Operating income 364 Less: Interest 88 Taxes 100 188 Net income 176 Add: retained earnings at start of year 860 1,036 Less: Cost of repurchase of shares 32 Dividends paid 31 63 Retained earnings at end of year 973
Canadian Tire: Consolidated Balance Sheet: $ million, as at the end of:2001 Current assets: Cash 579 Accounts receivable 959 Inventory 441 Prepaid expenses 14 Total current assets 1,993 Long-term assets (net) 2,378 Total assets 4,371 Current liabilities 1,110 Long-term liabilities 1,357 Total liabilities 2,467 Minority interest 300 Shareholder’ equity: Share capital 622 Retained earnings 982 Total shareholders equity 1,604 Total liabilities & shareholders’ equity 4,371
Liquidity Current ratio: Definition: Current assets/current liabilities $1,993/$1,110 = 1.8:1 Reasonable liquidity, close to the norm of 2:1 Quick ratio: Definition: (Current assets – inventories)/current liabilities ($1,993 - $441)/$1,110 = 1.4:1 Relatively high liquidity, well above the norm of 1:1
Return on sales %: Definition: Operating income/sales * 100 $364/$5,374 * 100 = 6.8% This is a relatively low margin business, and Canadian Tire is probably operating at the low end of the range. Return on assets %: Definition: Operating income/total assets * 100 $364/$4,371 = 8.3% A very modest return on assets Return on equity %: Definition: Net income/shareholders' equity * 100 $176/$1,604 = 11.0% This is a modest return for a business investment. Would shareholders have been better off if they had invested in shares of other companies? Profitability
Debt to Assets %: Definition: Total debt/total assets * 100 $2,467/$4,371 =56% Debt to equity %: Definition: Total debt/total equity * 100 $2,467/$1,904 = 130% The debt is a little on the high side being over the norm of 50% (debt to assets) or its equivalent 100% (debt to equity). The “minority interest” is problematical in this analysis. It refers to shares in subsidiary companies held by outside investors. It has been treated as equity here to calculate the debt to equity ratio, but it has been ignored above in the calculation of the return on equity. Interest cover ratio: Definition: Net income (after tax, before interest)/interest paid ($176 + $88)/$88 = 3 X This is safe: earnings would have to fall to one third of their present level before interest payments were under threat, Debt
Efficiency – Assets and Receivables Total asset turnover Definition: sales/total assets $5,374/$4,371 = 1.2 X Assets are turned over 1.2 times per year. This is not a capital-intensive business, so this ratio is relatively low. Receivables turnover ratio: Definition: sales/receivables $5,374/$959 = 5.6 X Receivables collection period: Definition: receivables/ (sales/365) $959/($5,375/365) = 65 days Receivables are turned over 5.6 times every year, in other words the average age of receivables is 65 days. In most retailing businesses this would be excessive, but Canadian Tire credit accounts are much like credit cards, and charge a high interest rate, so it is not a wasted investment. Inventory turnover: Definition: sales/inventory $5,374/$441 = 12,2 X Inventory holding period: Definition: inventory/ (sales/365) $441/($5,374/365) = 30 days Inventory is turned over 12.2 times per year, in other words it is held for only 30 days on average. For a retailer of non-perishable goods this is a highly efficient.
Efficiency - Inventory Inventory turnover: Definition: sales/inventory $5,374/$441 = 12,2 X Inventory holding period: Definition: inventory/ (sales/365) $441/($5,374/365) = 30 days Inventory is turned over 12.2 times per year, in other words it is held for only 30 days on average. For a retailer of non-perishable goods this is a highly efficient.
Market Ratios Earnings per share: Definition: net income/number of common shares (there were approximately 75 million common shares in issue) $176/75 = $2.35 Dividend cover ratio Definition: net income/dividend $176/$31 = 5.7 X This is very safe: there are $5.70 of earnings for every $1 of dividend