Rates and Standardization
160 likes | 390 Vues
4. Rates and Standardization. Rates To make comparisons among groups more meaningful, rates may be used instead of raw numbers. Rate = the number of cases of a particular outcome of interest that occur over a given period of time / the size of the population in that time period

Rates and Standardization
E N D
Presentation Transcript
4 Rates and Standardization
Rates To make comparisons among groups more meaningful, rates may be used instead of raw numbers. Rate = the number of cases of a particular outcome of interest that occur over a given period of time / the size of the population in that time period Infant mortality rate = number of deaths during a calendar year among infants under one year of age / the total number of live births during that year (unit = per 1000 live births) Chapter4 p67
Figure 4.1 Trends in the crude marriage and divorce rates, USA, 1950-1994. Chapter4 p70
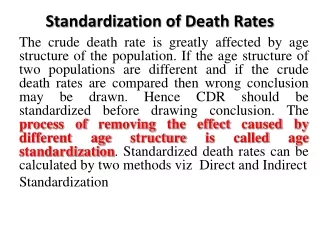
Standardization of rates Hearing impairment due to injury reported by individuals 17 years of age and older in 1980-1981 It appears that individuals who are not in the labor are at greater risk of hearing impairment due to injury than those who are currently employed. = 947/163157 Age group Differ in age composition individuals not included in the labor force are older than those who are currently employed
Age-specific impairment rates in the surveyed population as a whole = 441/94930 Age-specific impairment rates for the two subpopulations, Currently employed and Not in the labor force = 80/20760 How many impairments in the age group 17-44, 45-64, and 65+ for the currently unemployment subpopulation? 15, 12, 0
Direct method of standardization Expected age-specific impairment rates for the two subpopulations, using Currently employed rate per 1000 and Not in the labor force rate per 1000 (3) = (1) x (2)/1000 (5) = (1) x (4)/1000 Age-adjusted impairment rates for the Currently employed and Not in the labor force Currently employed : 965.0/163157 = 5.91 per 1000 Not in the labor force : 904.3/163157 = 5.54 per 1000 After we control for the effect of age, impairment rates for the currently employed > impairment rate not in the labor force opposite of what we observed when we looked at the crude rates influenced by the age structure
Indirect method of standardization Expected age-specific impairment rates for the two subpopulations, using Currently employed rate per 1000 and Not in the labor force rate per 1000 surveyed population rate (3) = (1) x (2)/1000 (5) = (1) x (4)/1000 Currently employed : 552/536.9 = 1.03 Not in the labor force : 368/372.4 = 0.99 The currently employed individual has a 3% higher impairment rate than the surveyed population Those not in the labor force individual has a 1% lower Direct method of standardization is used more often than the indirect method.
Vertical bars = change in disease classification The standardized rates were calculated by means of the direct method the US population in 1940 The adjusted rates have been decreasing for the most part except the HIV death rate. HIV – a new disease Chapter4 p77
Subgroup death rates for men and women Figure 4.3 Death rates from leading causes of death for men and women 25 to 44 years of age, USA, 1982-1992 Chapter4 p82
Direct method of standardization subgroup-specific rates should have the same general trends in all groups being compared, as shown in Fig. 4.4(a) such as calendar years, age Chapter4 p83
A somewhat less ideal situation occurs when the trends are not parallel such as calendar years, age Chapter4 p83
The subgroup-specific rates follow very different patterns in the two populations, Direct method of standardization should not be attempted. such as calendar years, age Chapter4 p83
The graph most closely resembles Fig. 4.4(b) direct method of standardization is appropriate to use Chapter4 p84
Applications Chapter4 p87
Exercise Chapter4 p66