Adjusted Rates - Direct Standardization
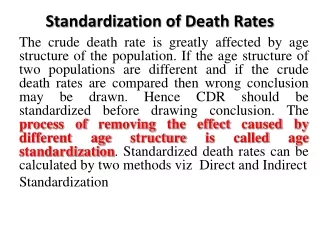
Adjusted Rates - Direct Standardization. Population A 50,000 people 4,000 cancer deaths in a year crude rate = 800 per 10,000. Population B 52,000 people 5,080 cancer deaths in a year crude rate = 977 per 10,000. Crude Rates.

Adjusted Rates - Direct Standardization
E N D
Presentation Transcript
Population A 50,000 people 4,000 cancer deaths in a year crude rate = 800 per 10,000 Population B 52,000 people 5,080 cancer deaths in a year crude rate = 977 per 10,000 Crude Rates Overall rates, e.g., obtained by dividing total cancer deaths by total population. Population B has a higher crude rate. Does this mean that the risk of cancer death is greater in “B”? Are there greater environmental risks in “B”?
/ / Age-Specific Rates Population “A” Population “B” • Is it riskier to live in population “B”? • Why are the overall (crude) death rates different?
Age Age Pop. A Pop. B Age is an additional factor that is affecting the comparison. (confounding)
A Crude Rate Is a Weighted Average of Age-Specific Rates (Wgt.) Rate (Wgt.) Rate AgePop.% Deaths/10kPop.%Deaths/10k 30-39 10,000 20% 400 400 2,000 3.85% 80 400 40-49 10,000 20% 600 600 5,000 9.62% 300 600 50-59 10,000 20% 800 800 10,000 19.23% 800 800 60-69 10,000 20% 1,000 1,000 15,000 28.85% 1,500 1,000 70-79 10,000 20% 1,200 1,200 20,000 38.46% 2,400 1,200 50,000 4,000 52,000 5,080 Crude rate - 4,000/50,000 = 800/10,000 Crude rate = 5,080/52,000 = 977/100,000 Young Old Young Old
A Crude Rate Is a Weighted Average of Age-Specific Rates (Wgt.) Rate (Wgt.) Rate AgePop.% Deaths/10kPop.%Deaths/10k 30-39 10,000 20% 400 400 2,000 3.85% 80 400 40-49 10,000 20% 600 600 5,000 9.62% 300 600 50-59 10,000 20% 800 800 10,000 19.23% 800 800 60-69 10,000 20% 1,000 1,000 15,000 28.85% 1,500 1,000 70-79 10,000 20% 1,200 1,200 20,000 38.46% 2,400 1,200 50,000 4,000 52,000 5,080 Crude rate - 4,000/50,000 = 800/10,000 Crude rate = 5,080/52,000 = 977/100,000 .20 x 400 = 80 .0385 x 400 = 15.40 .20 x 600 = 120 .0962 x 600 = 57.72 .20 x 800 = 160 .1923 x 800 = 153.84 .20 x 1,000 = 200 .2885 x 1,000 = 288.50 .20 x 1,200 = 240 .3846 x 1,200 = 461.52 SUM 800 SUM 977 The crude rate is weighted by the age distribution.
What if two populations have different age distributions and age affects the cancer rate …? The Real Question How would the overall cancer mortality rates compare if the age distributions were the same?
Adjustment (Standardization) If populations being compared have different distributions with respect to age, or other factors, …one can calculate adjusted rates that take into account differences in the structure of the populations being compared. The adjusted rates artificially make the two populations have identical distributions of the confounder (age, race, gender, etc.). Basically, we ask the question, “What if the population distributions were (weighted) the same with respect to the confounder? Then, how would the rates compare?
Comedian Robert Klein: “I don’t know about this Florida thing. All I know is that I had two perfectly healthy 65 year old parents. They move down to Florida and then, bang, thirty years later they’re dead. I don’t know … do you think it’s something in the air or the water down there?”
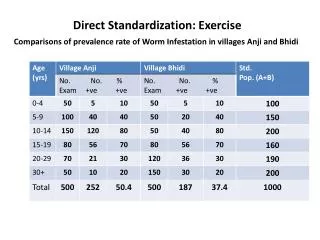
Death Rates In Florida & Alaska FloridaAlaska Number of deaths 131,902 2,116 Total population 12,340,000 530,000 Crude mortality rate \(per 100,000) 1,069 399 The crude rates are clearly different. Does this mean that it is riskier to live in Florida? If you are about to retire, would it be better to move to Alaska?
Note: The Age-Specific Rates are Similar Florida % of total Rate per Alaska % of total Rate per AgePop.(Weight)100,000Pop. (Weight) 100,000 <5 850,000 7% 284 60,000 11% 274 5-19 2,280,000 18% 57 130,000 25% 65 20-44 4,410,000 36% 198 240,000 45% 188 45-64 2,600,000 21% 815 80,000 15% 629 >65 2,200,00018%4,42520,0004%4,350 Totals 12,340,000 100% 530,000 100% This contributes 18% to the overall rate. FloridaAlaska Crude mortality rates (per 100,000) 1,069 399 The crude rates are very different, but crude rates are weighted averages of the age-specific rates, and Florida’s population is weighted more heavily with older people. The comparison is confounded by age differences.
Direct Standardization The Solution: use each population’s actual age-specific rates, but calculate a summary rate using a single (standard) age distribution (i.e. artificially weight them the same with respect to age distribution.) This is adjustment by Direct standardization. The “adjusted” rates are artificial, but they provide summary rates that can be compared without confounding by age differences.
Florida As The Standard: Adjusted Mortality Rates (#1) Florida % of total Rate per Alaska % of total Rate per AgePop.(Weight)100,000Pop.(Weight)100,000 <5 850,000 7% 284 60,000 11% 274 5-19 2,280,000 18% 57 130,000 25% 65 20-44 4,410,000 36% 198 240,000 45% 188 45-64 2,600,000 21% 815 80,000 15% 629 >65 2,200,00018%4,42520,0004%4,350 Totals 12,340,000 100% 530,000 100% .07 x 284 = 19.88 .07 x 274 = 19.18 .18 x 57 = 10.26 .18 x 65 = 11.70 .36 x 198 = 71.28 .36 x 188 = 67.68 .21 x 815 = 171.15 .21 x 629 = 132.09 .18 x 4,425 = 796.50 .18 x 4,350 = 783.00 SUM 1,069/ 100,000 pop. SUM 1,014/ 100,000 pop. (Age-adjusted)
Average of Florida & Alaska Distributions as the Standard: Adjusted Mortality Rates (#2) Florida Alaska Age% Pop.% Pop.Average <5 7% 11% (9.0%) 5-19 18% 25% (21.5%) 20-44 36% 45% (40.5%) 45-64 21% 15% (18.0%) >65 18%4%(11.0%) 100% 100% 100% WeightRate WeightRate .090 x 284 = 25.56 .090 x 274 = 24.66 .215 x 57 = 12.26 .215 x 65 = 13.98 .405 x 198 = 80.19 .405 x 188 = 76.14 .180 x 815 = 146.70 .180 x 629 = 113.22 .110 x 4,425 = 486.75 .110 x 4,350 = 478.50 SUM 751/ 100,000 pop. SUM 707/ 100,000 pop. Age-adjusted
1988 U.S. Population as the Standard: Adjusted Mortality Rates (#3) Florida Alaska Age% Pop.% Pop.1988 U.S. <5 7% 11% (7%) 5-19 18% 25% (22%) 20-44 36% 45% (40%) 45-64 21% 15% (19%) >65 18%4%(12%) 100% 100% 100% WeightRate WeightRate .07 x 284 = 19.88 .07 x 274 = 19.18 .22 x 57 = 12.54 .22 x 65 = 14.30 .40 x 198 = 79.20 .40 x 188 = 75.20 .19 x 815 = 154.85 .19 x 629 = 119.51 .12 x 4,425 = 531.00 .12 x 4,350 = 522.00 SUM 797/ 100,000 pop. SUM 750/ 100,000 pop.
Adjustment By Direct Standardization • Provides summary rates (all ages) that remove the unwanted effects of differences in the distributions of confounders in the populations. However, the adjusted rates are not real. (Only good for comparison.) • Standardization doesn’t always make the two rates more similar (can be more different or no difference). • It just allows a fairer comparison after ironing out some of the “other” differences that might be exaggerating or masking differences between the populations. • Direct standardization may involve more than 2 groups.
Death Rates in Weymouth Versus Woburn Was there confounding by age? • Look at the crude rates. • Look at the adjusted rates. • How is the comparison affected by adjusting for a factor, such as age? • Are the apparent differences greater or smaller? • Did age differences exaggerate differences between the two groups? • Did age differences mask differences between the groups?
Compare The Crude & Adjusted Rates #1 What is your interpretation? Did age differences have a confounding effect? Were the populations different after adjusting for age? WeymouthWoburn Crude: 250/10,000 vs. 750/10,000 Age Adjusted: 376/10,000 vs. 383/10,000 Crude Adjusted
Compare The Crude & Adjusted Rates #2 What is your interpretation? Did age differences have a confounding effect? Were the populations different after adjusting for age? WeymouthWoburn Crude: 250/10,000 vs. 750/10,000 Adjusted: 376/10,000 vs. 512/10,000 Crude Adjusted
Compare The Crude & Adjusted Rates #3 What is your interpretation? Did age differences have a confounding effect? Were the populations different after adjusting for age? WeymouthWoburn Crude: 250/10,000 vs. 750/10,000 Adjusted: 306/10,000 vs. 813/10,000 Crude Crude Adjusted Adjusted
Compare The Crude & Adjusted Rates #4 What is your interpretation? Did age differences have a confounding effect? Were the populations different after adjusting for age? WeymouthWoburn Crude: 250/10,000 vs. 266/10,000 Adjusted: 276/10,000 vs. 450/10,000 Crude Adjusted
1,200 1,000 800 Age-adjusted rate/100,000 600 400 200 0 Age-adjusted mortality rates, by race & ethnicity, MA 2001 1,050 813 617 452 Black non- White non- Hispanic Asian/PI Hispanic Hispanic Age-adjusted to the 2000 U.S. standard population
It’s The Same Population, But At Multiple Times (It’s Like Comparing Multiple Populations) 1992 1990 1985 1980