Download
1 / 40
400 likes | 580 Vues
Source of much of the information and graphics for this presentation Intergovernmental Panel on Climate Change (IPCC). Birthed by United Nations Mandate to synthesize scientific consensus on climate change and its impacts

E N D
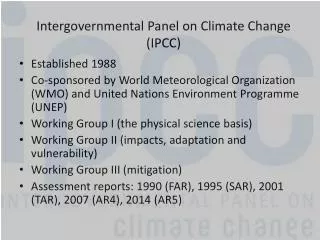
Source of much of the information and graphics for this presentationIntergovernmental Panel on Climate Change (IPCC) • Birthed by United Nations • Mandate to synthesize scientific consensus on climate change and its impacts • First Report 1995: Global synthesis of climate data & models and projections of impacts • Second Report 1998: Regional analyses of climate trends, future climate scenarios, and impact scenarios for natural and human systems • Third Report 2001: 3 Working groups, 23 disciplines, 1200 scientists. Much more actual observations of changes in climate and in impacts. Improved climate projections. Improved “attribution” • Fourth Report in progress - due out 2007
Research from the climate science community over the past decade has strengthened the causal links between observed changes in Earth’s climate system and human activities • IPCC 1995 (First Assessment Report) • Global warming has occured, and it may be due to anthropogenic greenhouse gas emissions • IPCC 1998 (Second Assessment Report) concluded that: • “ The balance of evidence suggests a discernable human influence on global climate.” • IPCC 2001 (Third Assessment Report) concluded that • “ Most of the observed warming over the last 50 years is likely to have been due to the increase in greenhouse gas concentrations.”
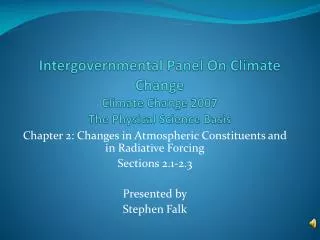
Greenhouse gases = gases that absorb and emit infrared radiation (heat). Presence of greenhouse gases in lower atmosphere traps heat & raises global temperature. Durations up to 100 years. Main ones: • Water vapor • Carbon dioxide (industry, cars, wood fires) • Nitrous oxide (fertilizing & tilling land, industry, cars) • Methane (wetlands, rice paddies, cows) • Ozone (air pollution)
Indicators of the Human Influenceon the Atmosphere during the Industrial Era
Global average temperatures are increasing with increases in CO2. Global Average Temperature
The Relative Influences of Different “forcing” Factors on Global Temperatures
Models show warming of 1930s/40s was due to natural factors (the sun, fig a), but warming of last 30 years was due to humans (fig b)
The relationship between temperature and carbon dioxide over the past 160,000 years. Current 380 ppm • Clear correlation between atmospheric CO2 and temperature over last 750,000 years (not all shown) • Current level of CO2 is outside bounds of natural variability • Rate of change of CO2 is also unprecedented Source: OSTP
Climate Change Attribution:How do climate scientist “know” that current warming is caused by humans? Fingerprint in climate data Fingerprint in ocean temperatures & processes Fingerprint in ocean circulation changes Model simulations
Percent of the Continental U.S. with A MuchAbove Normal Proportion of Total Annual Precipitation From 1-day Extreme Events(more than 2 inches or 50.8mm) Source: Karl, et.al. 1996.
All are statistically significant changes • All have been causally linked to human activities (primarily burning of oil, coal & gas). This is called “attribution” Observed changes in Earth’s climate since 1860 Increased global mean temperature, and more heat waves Sea level has risen by several inches Increased global cloudiness Warming mainly at night and during winter Increased global rain and snowfall, and more very heavy rain and snow days (floods and winter storms) More frequent and more intense El Niño years More severe hurricanes in the Atlantic Large declines in most temperate and tropical glaciers (30% - 60% volume loss) Large decline in Arctic sea ice, freshening of Arctic & N Atlantic oceans, slowing of North Atlantic conveyor belt
Global Climate Models Global Climate Model: GCM Atmosphere-ocean general circulation models AOGCM (coupled ocean and atmosphere models) Regional Models - higher resolution than GCMs
Other terms • Ensemble = often means many simulations done w/same model & same forcing, but different initial conditions • Or, can mean taking the mean (average) of many different model outputs
1-3 = diff realizations of CCCma CGCM1 model4 = ensemble mean of the 4 outputs with different initial conditions done with same model
Why do climate projections differ? • Different resolution: 1.5 - 5° LL, 1° latitude ~ 100 km. (affects ability to model small scale weather & climate events, like thunderstorms) • Different “sensitivities” (how much warming occurs for given change in a radiative forcing, like a doubling of CO2) • Different parameterizations (estimations) of processes they don’t have direct data for (e.g. clouds) • Differences in what processes are coupled into model (Oceans? Land use change?) • Different emissions scenarios
Greenhouse Gas Emission Scenarios • A1 = techno-world: rapid economic growth & techno- growth, but remains heavily dependent on fossil fuels. Different A1 scenarios are for diff techno development • A2 = business as usual • B1 = Green global: economies shift towards less materialism and techno-fix of more renewables. Economies still run “globally” (as now) • B2 = Green local: strong emphasis on local economies and sustainable development, with moderate techno and economic growth
ensemble temperature projections (all models used, take the mean) Top fig: A2 bottom fig: B2 scenarios
Ensemble precipitation projections, A2 (be as usual) & B2 (green local) scenarios
GCMs • scales of 5°x5° Lat/long (500 km2) to 2.5°x2.5° (250 km2). Hadley is now going to 1.5° in new model • theoretically can do 50km, but not practical • many models, each good/bad at something • “sensitivity” = how much warming does model give for fixed forcing once reaches equilibrium (usu 2xCO2) • w/o ocean, system stabilizes in 10s yrs • w/ocean coupled, takes 1000s yrs
Differences among models in projected average global temperature increase for a given emission scenario From IPCC 2001
Level of agreement among models for projected temperatures Level of agreement among models
Level of agreement among models for projections of precipitation
Averages vs Individuality • Problem - majority rules • Can show each model, but still ask about level of model agreement - so maj still rules • Exceptions or extremes may be most likely • Exceptions or extremes may be unlikely but high impact (e.g. shutdown of N. Atlantic circulation) • Solution - show ensembles, but also show extremes
Ocean currents also distribute heat around globe Ocean Circulation Systems. Driven by winds, thermohaline circulation (salty cold water drops down, fresh warm water floats up), and tides Rahmstorf, S. 2002. Nature 419:207
Low probability, high impact extreme event: The “Day After Tomorrow” scenario Shutdown of North Atlantic Deep Water Circulation - figure shows changes in surface air temperature if conveyor belt in Atlantic shuts down Rahmstorf, S. 2002. Nature 419:207
Global temperature over the past 65 million years. 55 million years 6 5 million years 10million years 3.5 Million years 18,000 years 1 Million years 10,000 years 230,000 years 1,000 years PRESENT 13 mya 1,000 ya 65 mya
Impacts Resulting from Projected Changes in Extreme Climate Events
Impacts Resulting from Projected Changes in Extreme Climate Events