Download
1 / 59
590 likes | 902 Vues
Local Density of States Modulations in Cuprate Superconductors. C. S. Ting Texas Center for Superconductivity, University of Houston Collaborators: H. Y. Chen and D. G. Zhang. OUTLINE. A. Temperature Effect---High Temperature Results

E N D
Local Density of States Modulations in Cuprate Superconductors C. S. Ting Texas Center for Superconductivity, University of Houston Collaborators: H. Y. Chen and D. G. Zhang
OUTLINE A. Temperature Effect---High Temperature Results 1. Background --- The relevant STM experiments and the issue • Our approach: d-wave superconductivity with the competing AF order --- phenomenological (t-t’-U-V) model • Results ----comparing with the measurements 4. Some Remarks
OUTLINE B. Temperature Effect—Low Temperature Results • Background • Our Results in k-Space • Our results in Real Space • Some Remarks • Effect of Electron-Electron Interactions Conclusion
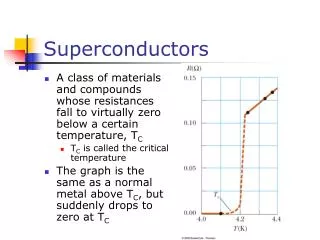
1. Background--STM (Scanning tunneling microscope) The current which flows between the tip and the sample can be calculated by J. Hoffman, Ph.D Thesis
1. Temperature Effect --- STM on BSCCO An energy- independent checkerboard pattern in the pseudogap state T=100K Vershinin et al., Science (2004) TC = 80 K Only energy dependent modulations in the superconducting state T=40K
1. Checkerboard Pattern at High Temperature b b=2π/qA=4.7a qA is energy independent The checkerboard pattern observed at T=100k ---- charge order (?) No charge order is observed at low T
Background --- STM on BSCCO • High Temperature--Pseudogap State The energy-independent modulation in LDC → A checkerboard pattern with incommensurate periodicity 4.7a±0.2a as compared with the underline CuO2 square lattice—static charge order • Low Temperature--d-Wave Superconducting state Only energy-dependent LDOS modulations— no charge order T=100K TC = 80 K T=40K
Background --- Theoretical Approach • Because of recent discoveries of AF order in HTS by neutron scattering, NMR and other experiments, the dSC with competing AF order have become an active research area in this system. • We shall based on this concept to study the experimental observation. • Chen and Ting, cond-mat/04052221 (PRB, 2005)
2. Model We shall use the t-t’-U-V model/ phenomenological approach: U= onsite Coulomb interaction --- competing AF order V=attractive interaction between NN --- dSC Why not the t-J model? The t-J model as a standard model for strongly correlated electron system has been studied extensively at zero temperature, so for there exists no finite temperature theory. Even at T=0, theories used different approaches yield different results. For example, finite lattice calculations using exact diagonalization show no long range SC correlation in the doping range <0.2.
2. Some Phase Diagrams t-J model SDW RVB DSC and DDW Nèel and singlet RVB orders in the t-J model Fukuyama et al.,Physica C (1996) Zhu, et al., PRL (2001)
2. Our Phase diagram (competing order) = 0.15, N=24 X 48
3. Spatial profiles and images at T=0.84TN dSC = |i| 5a-5a-4a-5a-5a SDW = Mi 10a-9a-10a-9a-10a CDW = ni 5a-5a-4a-5a-5a
Why Stripes Show Up? qA(x) and qA(y) can be regarded as nesting wave vectors. For CDW the numerical result only yields qA(x) or qA(y) as the nesting vector which would give y-oriented stripes or x-oriented stripes. In order to get the checkerboard pattern, qA(x) and qA(y) must appear at the same time, unless putting in by hand, this never happens in any self-consistent calculations. ,
3. Fourier transformation at E=0.1t T=0.84TN LDOS = ρi(E)T 5a-5a-4a-5a-5a Average periodicity =4.8a
Checkerboard pattern at T =0.84Tn > Tc The superposition of the x- and y- oriented stripes The average periodicity of the checkerboard pattern is4.8a.
Normalized Fourier amplitude Vershinin et al, Science (2004)
4. Some Remarks • The existence of the charge order or the checkerboard pattern in the LDOS depends on the presence of the SDW, not on the dSC in the sample. • The drawback of the present work is that we are not able numerically to produce the checkerboard CDW observed by the experiment. In order to explain the experiment, we have to assume that the x-oriented stripe and y-oriented stripe have equal probability to show up during the time interval when the experiment is performed.
4. Additional Remarks ** There existed similar theoretical studied in this respect, but the charge density wave which generates the checkerboard pattern has been put in by hand, and the CDW appears both at high and low T, inconsistent with experiments. ** Very recent ARPES experiment indicates that the order studied here may not be a real charge order---- This will be discussed next.
ARPES and Modulation Wavevectors J. C. Campuzano et al., Cond-mat/0505296 ARPES measures the photo-currrent I ejected from the surface of BSCCO by x-ray photon I (k, ) ~ |Mi,j|2 f () A(k, ) A(k, ) = Single particle spectral function The auto-correlation function measures the modulation wavevectors: C(q, ) ~ A(k+q, )A(k, )d2k
[ J. C. Campuzano et al., Cond-mat/0505296.] T=90k and Tc=80k SC gap disappears in the fermi arc region and the pseudo-gap still exists in the anti-nodal region. The modulation vectors q* =qA and q** is energy independent for <20mev. For >20mev, q* and q** become dependent. The reason for this is not clear at this moment, but they claim that this should not be a charge order, this needs to be further examined.
B. Low Temperature Results • The system is in pure dSC state and the modulations in the LDOS are (bias) energy dependent—No static charge order • Vershinin et al., Science (2004) • J. E. Hoffman, et al., Science (2002)
STM experiment[J. E. Hoffman, et al., Science 297, 1148 (2002)] • (A) 0 mev LDOS. The image shows checkerboard-like modulations. • (B) 12 mev LDOS. The image shows the modulations along 45º to the Cu-O bonds. • (C) 16 mev LDOS. The image shows the modulations oriented both 45º to and along the Cu-O bonds. • (D) 22 mev LDOS. The image shows the modulations along the Cu-O bonds.
The Energy Dependent Checkerboard Pattern—Not a CDW b b=2π/qA E=22 meV c=2π/qB E=16 meV c Here b and c [or qA and qB ] are energy dependent
STM experiment[J. E. Hoffman, et al., Science 297, 1148 (2002)] • The Fourier transforms of LDOS images at different energies. The peaks along the Cu-O bonds move towards the origin slowly. The peaks along 45º to the Cu-O bonds move away the origin quickly.
Theoretical Understanding: Energy Dependent Modulation Wavevectors— Elastic scattering of quasiparticles with weak impurities or defects Wang and Lee, PRB-R (2002) Zhang and Ting, PRB-R (2002) Chen and Yeh, PRB(R) (2003) Method—T-matrix in k-space.
Fourier components of LDOS The Fourier component of LDOS ) q(E) for the optimal doping at different energy in the first Brillouin zone. • At E=0 mev, there are weak peaks along (, 0)and (, ) directions. • For negative energies, with energy increasing, qA becomes shorter while qB , qC and qD become longer; The peaks at qA become stronger while those at qB become weaker. This means that the LDOS modulation along (, ) direction changes to that along (, 0) direction. • For positive energies, the modulation wave vectors are same with those for negative energies. But q(E) has local minimum values at qB , qC and qD .
The Expected LDOS Patterns Due to qA and qB b b=2π/qA E=22 meV c=2π/qB c Here b and c [or qA and qB ] are energy dependent
Spatial Profiles of LDOS Around a Weak DefectZhang and Ting, PRB (2003)
b c b=2π/qA c=2π/qB
Some Remarks • Scattering of quasiparticles with a defect gives rise to the experimentally observed modulation wavevectors (i.e., qA and qB )which are bias energy dependent. b. Checkerboard pattern would not form around a single impurity in real space. c. Only small regions of checkerboard pattern are formed as a result of interference among randomly distributed defects.
Other Possibility—Electron-Electron Interaction The origin of the checkerboard pattern in real space ? We suggest that experimentally observed checkerboard pattern is originated in the quasiparticle scatterings due to the short or long range Coulomb interactions among them. The idea can be seen from the following sketches (work is in progress) :
Quasiparticle-Quasiparticle Scatterings qA(x) =qA(y) b
Quasiparticle-Quasiparticle Scatterings qB = qB’ c
Conclusion The issues associated with the STM experiments have not been completely understood and more works are needed. • The origin of the checkerboard pattern observed by STM in the pseudogap region ( at high T) for BSCCO in the slightly underdoped sample is not clear. The pseudogap may be due to : a. Spin pairing (particle-particle) b. AF or CDW order (particle-hole nesting) near the anti-nodal regions. • The energy dependent checkerboard pattern observed at low T, needs to be explained by considering the e-e interactions.
Magnetic Field Effect Magnetic Field Effect • Background—Experiments and the Issue • d-wave superconductivity with the competing AF order ---(t-t’-U-V) model Chen and Ting cond-mat/0402141 (PRB-(R), 2005) • Results • Conclusions
Background --- (I) Experiments 10a J. Hoffman et al., Science (2002) STM on BSCCO under a magnetic field (H = 7T) • The four unit cell checkerboard pattern is localized in a small region around the vortex. • The intensities are exponentially decaying away from the vortex.
The Issues: In the Presence of a Magnetic Field at Low T 1. Checkerboad Pattern Observed J. Hoffman et al., Science (2002) 2. Checkerboard Pattern Not Being Observed, and No Clear 4-Fold Symmetry for the Vortex Core S.H. Pan et al., PRL(2000)
Background --- (II) Theories CDW • Two-Dimensional SDW • S.C. Zhang et al., PRL(2002). • S. Sachdev et al., PRB(2002). • J.X. Zhu et al., PRL(2002). • Stripe Modulation • Y. Chen et al., PRB(2002). • B. Halperin et al., PRB(2003). • S.A. Kivelson et al., RMP(2003). J.X. Zhu et al., PRL(2002). CDW Charge density configuration in the ground state STM Spectra (LDOS) Low energy excitations