Phylogenetic Tree
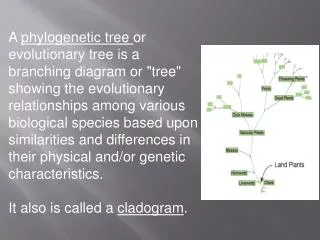
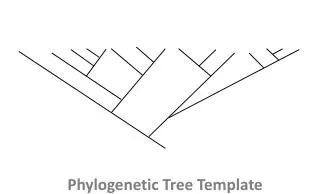
Phylogenetic Tree. A Phylogeny (Phylogenetic tree) or Evolutionary tree represents the evolutionary relationships among a set of organisms or groups of organisms a family related nucleic acid or protein sequences Every phylogenetic tree is an hypothesis about relationships

Phylogenetic Tree
E N D
Presentation Transcript
Phylogenetic Tree A Phylogeny (Phylogenetic tree) or Evolutionary tree represents the evolutionary relationships among a set of organisms or groups of organisms a family related nucleic acid or protein sequences Every phylogenetic tree is an hypothesis about relationships some are well supported by data others are not
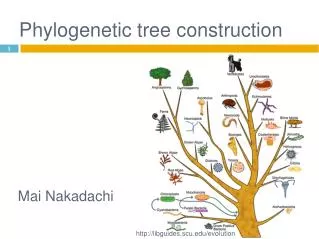
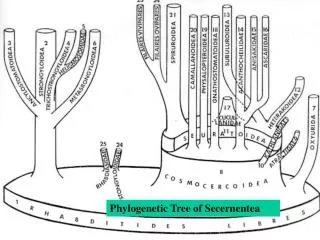
Dendrogram, Cladogram, Phylogram • Dendron- Tree • Dendrogram is any type of diagrammatic representation of phylogenetic trees. • All four trees depicted here are dendrograms. • Cladogramis a tree in which branch lengths DO NOT represent evolutionary time; cladesjust represent a hypothesis about actual evolutionary history TREE1 and TREE2 are cladograms and TREE1 = TREE2 • Phylogramis a tree in which branch lengths represent evolutionary time; cladesrepresent true evolutionary history (amount of character change) TREE3 and TREE4 are phylograms and TREE3 ≠ TREE4
What data is used to build trees? • Traditionally: Physical characteristics (morphological features) • Currently: Mostly Biomolecular sequences: DNA, RNA, amino acid etc. and Molecular markers (SNPs, RFLPs etc.)
Data for Phylogeny – Numerical data • Distance between objects e.g., distance(man, mouse)=500, distance(man, chimp)=100 Usually derived from sequence data – Discrete characters • Each character has finite number of states e.g., number of lineages = 1, 2, 4 DNA = {A, C, T, G}
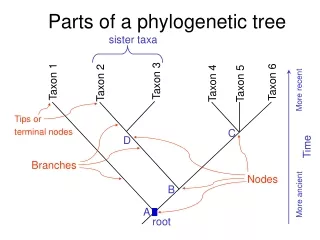
Types of trees: unrootedvs rooted • A rootedphylogenetic tree is a tree with a unique root node corresponding to the most recent common ancestor of all the entities at the leaves of the tree. A rooted tree is a binary tree. • Unrooted trees illustrate the relatedness of the leaf nodes without making assumptions about common ancestry. An unrooted tree has a node with three edges; the rest of the nodes have up to two edges.
Rooted, Binary Tree Unrooted, Binary Tree
Branch Length (Distance) ~ Time Root (Common ancestor of all Operational Taxonomic Unit- OTU) Leaves /External node/OTO Edge/Branch/Lineage Internal Node (Common Ancestor)
This Rooted, binary tree can be illustrated as (((14, 15), (12, 13)), ((10, 11), (8, 9)))
Number of possible trees # of rooted trees = (2n-3)! 2n-2(n-2)! # of unrooted trees = (2n-5)! 2n-3(n-3)! Number of possible trees #no. of species /UTO (n) #rooted trees #unrooted trees 2 1 1 3 3 1 4 15 3 5 105 15 10 3.44x10⁷ 2.03x10⁶ 15 2.13x10¹⁴ 7.91x10¹² 20 8.20x10²¹ 2.21x10²⁰ A details of all possible trees to find the best one is not feasible!
Phylogenetic Tree Building • Distance based methods a. Calculate evolutionary distances between sequences (OTUs) b. Build a tree based on those distances • Maximum Parsimony (character based method) a. Find the simplest tree that explains the data with the minimum number of changes\substitutions • Maximum Likelihood (probabilistic method based on explicit model) a. Find the tree that gives the highest likelihood of the observed data 4. New Baysian approaches (also probabilistic)
Distance based methods Calculate evolutionary distances between sequences using a matrix of pairwisedistance Build a tree based on the distances of the sequences Find the tree with the shortest overall branch lengths -- UPGMA method (‘unweighted pair group method using arithmetic averages’) 1) Join the two sequences/species with the shortest distance 2) Add a sequence/species to that node if that average of all pairwise distances is minimized -- Neighbor Joining (NJ) method keeps track of the nodes and the leaves (rather than just the leaves) during tree building
Phylogeny Applications • Tree of life: Analyzing changes that have occurred in evolution of different organisms • Phylogeneticrelationships among genes can help predict which ones might have similar functions (e.g., ortholog detection) • Follow changes occuringin rapidly changing species (e.g., HIV)