Download
1 / 6
60 likes | 179 Vues
This document presents the results of multiple statistical tests conducted to evaluate various hypotheses (H0 and H1) concerning regression coefficients. The analysis includes t-tests and F-tests at different significance levels (5% and 1%). Findings indicate that several null hypotheses were rejected based on calculated t-values exceeding critical t-values, suggesting significant relationships in measured parameters. Notably, the analysis covers both positive and negative relationships with respect to regression coefficients, providing a comprehensive view of the data's statistical significance.

E N D
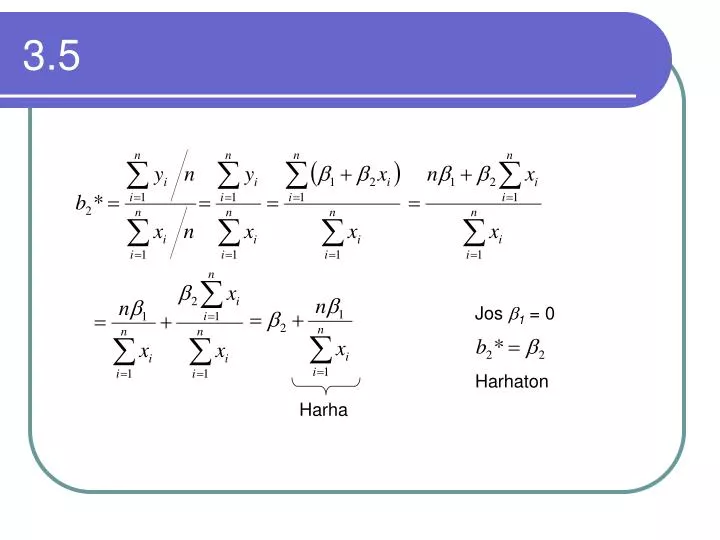
3.5 Jos b1 = 0 Harhaton Harha
3.9 H0: b2 = 0 H1: b2≠ 0 a = 0,05 tai 0,01 n = 60 t.025(58) = 2,00 t.005(58) = 2,66 1. b2 = 0,20, s.e.(b2) = 0,07 t = 2,86 t > t.005(58) H0 hylätään sekä 5% että 1% tasolla 2. b2 = -0,12, s.e.(b2) = 0,07 t = -1,71 |t| < t.025(58) H0 hyväksytään sekä 5% että 1% tasolla 1. b2 = 0,06, s.e.(b2) = 0,07 t = 0,86 t < t.025(58) H0 hyväksytään sekä 5% että 1% tasolla
3.13 2.1: b2 = 0,490 ; s.e.(b2) = 0,085 ; n = 25 H0: b2 = 0 H1: b2≠ 0 a = 0,05 t.025(23) = 2,07 H0 hylätään H0: b2 = 1 H1: b2≠ 1 H0 hylätään
3.13 jatkuu... 2.1: b1 =- 0,546 ; s.e.(b2) = 0,274 ; n = 25 H0: b1 = 0 H1: b1≠ 0 a = 0,05 t.025(23) = 2,07 H0 hyväksytään
3.17 H0: b2 = 0 a = 0,05 tai 0,01 n = 60 t.05(58) = 1,67 t.01(58) = 2,39 1. b2 = 0,20, s.e.(b2) = 0,07 H1: b2> 0 t = 2,86 t > t.01(58) H0 hylätään sekä 5% että 1% tasolla 2. b2 = -0,12, s.e.(b2) = 0,07 H1: b2< 0 t = -1,71 t.05(58) < |t| < t.01(58) H0 hylätään 5% ja hyväksytään 1% tasolla 1. b2 = 0,06, s.e.(b2) = 0,07 H1: b2> 0 t = 0,86 t < t.05(58) H0 hyväksytään sekä 5% että 1% tasolla
3.20 H0: b2 = 0 H1: b2≠ 0 a = 0,05 F.05(1;23) = 4,28 F > F.05(1;23) = 4,28 H0 hylätään a = 0,01 F.01(1;23) = 7,88 F > F.01(1;23) = 7,88 H0 hylätään a = 0,001 F.001(1;23) = 7,88 F > F.005(1;23) = 14,20 H0 hylätään