Download
1 / 16
200 likes | 446 Vues
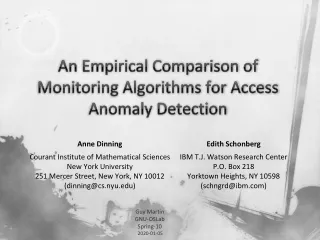
An Empirical Comparison of Microscopic and Mesoscopic Traffic Simulation Paradigms. Ramachandran Balakrishna Daniel Morgan Qi Yang Caliper Corporation 14 th TRB National Transportation Planning Applications Conference Columbus, OH • 8 th May, 2013. Outline. Motivation

E N D
An Empirical Comparison of Microscopic and Mesoscopic Traffic Simulation Paradigms RamachandranBalakrishna Daniel Morgan Qi Yang Caliper Corporation 14th TRB National Transportation Planning Applications Conference Columbus, OH • 8th May, 2013
Outline • Motivation • Dynamic Traffic Assignment • Challenges for model comparison • Methodology • TransModeler overview • Case study: Phoenix, AZ • Conclusion
Motivation • Dynamic Traffic Assignment (DTA) • Demand: short departure time intervals (5-15 min) • Supply: microscopic, mesoscopic, analytical, etc. • Microscopic (micro) vs. mesoscopic (meso) • Micro: Detailed driving behavior, network response • Meso: Aggregate/approximate traffic dynamics, control, queues • Need for objective comparison of micro, mesoDTAs • Emissions modeling, etc. require micro fidelity • However, DTA often used interchangeably with meso • Hardware, software advances facilitate micro DTA
Dynamic Traffic Assignment (1/2) • General DTA framework [Source: Ben-Akiva, Koutsopoulos, Antoniou and Balakrishna (2010) “Traffic Simulation with DynaMIT”. In Barcelo (ed.) “Fundamentals of Traffic Simulation”, Springer.]
Dynamic Traffic Assignment (2/2) • Network loading (supply) • Microscopic • Small time steps (0.1 second) • Car following, lane changing, reaction times • Explicit models of traffic control, lane utilization • Routing utilizes lanes, intersection geometry and delays • Outputs: Detailed trajectories, realized capacities • Mesoscopic • Large time steps (several minutes) • Macroscopic traffic dynamics e.g. speed-density functions • Approximate models of signals, lanes, capacities • Routing based on link-node representation • Outputs: Aggregate link performance
Challenges for Model Comparison (1/2) • Traffic simulation tools differ significantly • Software architecture • Data structures, loop implementation, procedures • Modeling features, assumptions, simplifications • Vehicle and user classes, value of time (VOT) • Network representation • Lanes, lane groups, turn bays • Shortest path, vehicle propagation algorithms • Default parameters • Visualization and output generation
Challenges for Model Comparison (2/2) • Literature review indicates diverse tool-dataset combinations • Comparison of existing studies is difficult • Need for calibration to common traffic data • Unclear methodologies for prior calibration • Differing performance measures, thresholds • Often impossible to replicate datasets across tools • Limited documentation of algorithms, assumptions • Missing data • Example: “stick” network, missing lane geometry info • Incompatible modeling assumptions • Example: single VOT, restricted signal timing plans
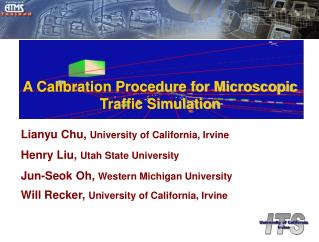
Methodology • Eliminate errors due to tool differences • Common platform for micro and meso • Shared software architecture • Consistent network representation logic • Identical input formats • Directly comparable outputs • Common dataset • Highway network • OD matrices, vehicle classes • Historical travel times, turn delays • Common model settings • Route choice model parameters, turn penalties, etc.
TransModeler Overview • Scalable micro, meso, hybrid simulation • Built-in Geographic Information System • Network accuracy, model fidelity, charting • Explicit handling of complex traffic control • Intelligent Transportation Systems (ITS) • High Occupancy Vehicle/Toll (HOV/HOT) • Electronic tolls (ETC) • Variable/Changeable Message Signs (VMS/CMS) • Dynamic Traffic Assignment (DTA)
Case Study: Phoenix, AZ (1/5) • Central Phoenix • Maricopa Association of Governments (MAG) • Spatial extent • 530 sq. miles; 890 zones • 17,000 nodes • 23,000 links; 35,000 segments • 1,800 signalized intersections • AM peak period • 6:00-9:00 AM • 812,000 trips
Case Study: Phoenix, AZ (2/5) • Micro model calibrated to match dynamic traffic count data • Time-varying demand • Congested travel times • Turn delays • Validated against INRIX speeds • Calibration and validation in subsequent presentation
Case Study: Phoenix, AZ (3/5) • Micro fidelity run times • 3.1 GHz Intel Xeon Dual Core 64-Bit CPU, 64 GB RAM • Averages from five replications
Case Study: Phoenix, AZ (4/5) • Comparison of segment flows • Default node delay calculations in meso • Indicates need for further capacity calibration in meso
Case Study: Phoenix, AZ (5/5) • Comparison of segment travel times • While meso is close, micro provides output fidelity
Conclusion • TransModeler • Objective platform for comparing fidelities • Microscopic fidelity • Feasible for planning applications • Practical run times on desktop hardware • Provides detail for modeling emissions, tolls, etc. • Additional calibration burden for meso • Needs more work to bring supply closer to reality • Next steps: more tests • Compare queue lengths, point-to-point travel times • Test different meso delay models • Quantify variance from multiple runs