Download
1 / 49
490 likes | 514 Vues
Understand the Balanced Scorecard framework, benefits, and steps for successful implementation in organizations. Learn how to align strategic objectives, improve communication, and drive performance effectively.

E N D
Balanced Scorecard A general overview
Gartner Group suggests that over 50% of large US firms have adopted the BSC • Bain & Co finds that about 44% of organisations in North America use the BSC • Germany, Switzerland, and Austria - 26% of firms use BSCs • The widest use of the BSC approach can be found in the US, the UK, Northern Europe and Japan http://www.ap-institute.com/Balanced%20Scorecard.html How many companies use the Balanced Scorecard?
The balanced scorecard is for everyone in the organization. This means that the balanced scorecard should be cascaded to all departments/business units and teams – both operating and support units. This is the only way to ensure successful strategy execution... Sandy Richardson, Strategy Focused Business Solutions Inc. Why?
developed in 1992 - Robert Kaplan and David Norton • Translating corporate vision and strategy into a set of strategic objectives that drive behavior and performance • built upon the premise that measurement motivates and that measurement must start with a clearly described strategy • pioneering work of General Electric on performance measurement reporting in the 1950’s and the work of French process engineers (who created the Tableau de Bord – literally, a "dashboard" of performance measures) in the early part of the 20th century history http://www.balancedscorecard.org/BSCResources/AbouttheBalancedScorecard/tabid/55/Default.aspx
establishing the linking between Balanced Scorecard and the Strategic Management system • BSC not linked to the Strategic management turns from the fundamental system into just the collection of the isolated indicators which do not have any influence on the strategic development of the company The Balanced Scorecard and the Strategic Management system
Better Strategic Planning –powerful framework for building and communicating strategy • Improved Strategy Communication & Execution –strategy with all its interrelated objectives is mapped on one piece of paper allows companies to easily communicate strategy internally and externally • Better Management Information • –forces organisations to design key performance indicators for their various strategic objectives • Research shows that companies with a BSC approach tend to report higher quality management information • Improved Performance Reporting –create meaningful management reports and dashboards to communicate performance both internally and externally • Better Strategic Alignment –align their organisation with the strategic objectives • Better Organisational Alignment –help to align organisational processes such as budgeting, risk management and analytics with the strategic priorities What are the Key Benefits of using Balanced Scorecards?
Developed by the Balanced Scorecard Institute • Step One: Assessment • Step Two: Strategy • Step Three: Objectives • Step Four: Strategy Map • Step Five: Performance Measures • Step Six: Initiatives • Step Seven: Automation • Step Eight: Cascade • Step Nine: Evaluation Building & Implementing a Balanced Scorecard: Nine Steps to SuccessTM http://www.balancedscorecard.org/BSCResources/TheNineStepstoSuccess/tabid/58/Default.aspx
Developed by the Balanced Scorecard Institute • Step One: Assessment- BSC Development Plan • assessment of the organization’s Mission and Vision, challenges (pains), enablers, and values • Preparation of a change management plan for the organization • conducting a focused communications workshop to identify key messages, media outlets, timing, and messengers • Step Two: Strategy- Customer Value • Strategic Results, Strategic Themes, and Perspectives, are developed -focus attention on customer needs and the organization’s value proposition • Step Three: Objectives- Strategy Action Components • Strategic Objectives are first initiated and categorized on the Strategic Theme level, categorized by Perspective, linked in cause-effect linkages (Strategy Maps) Building & Implementing a Balanced Scorecard: Nine Steps to SuccessTM http://www.balancedscorecard.org/BSCResources/TheNineStepstoSuccess/tabid/58/Default.aspx
Developed by the Balanced Scorecard Institute • Step Four: Strategy Map-Cause-and-Effect Links • the cause and effect linkages between the enterprise-wide Strategic Objectives are formalized in an enterprise-wide Strategy Map • Step Five: Performance Measures • Develop Performance Measures are for each of the enterprise-wide Strategic Objectives • Leadand lag measures are identified • Determine targets and thresholds, and • Develop baseline and benchmarking data • Step Six: Initiatives • Strategic Initiatives are developed that support the Strategic Objectives Building & Implementing a Balanced Scorecard: Nine Steps to SuccessTM http://www.balancedscorecard.org/BSCResources/TheNineStepstoSuccess/tabid/58/Default.aspx
Developed by the Balanced Scorecard Institute • Step Seven: Automation • Software • Performance Reporting • Knowledge Sharing • Step Eight: Cascade-key to organization alignment • Cascading a balanced scorecard means to translate the corporate-wide scorecard (referred to as Tier 1) down to first business units, support units or departments (Tier 2) and then teams or individuals (Tier 3) • Cascading translates high-level strategy into lower-level objectives, measures, and operational details • Determine performance measures at each level – more operational and tactical • Step Nine: Evaluation • Strategy Results • Revised Strategies Building & Implementing a Balanced Scorecard: Nine Steps to SuccessTM http://www.balancedscorecard.org/BSCResources/TheNineStepstoSuccess/tabid/58/Default.aspx
The Balanced Scorecard is just one of three levels in the business management process: • Top level: Company-wide Strategy maps • Middle Level: Balanced Scorecard • Bottom Level: Initiatives Business Management Process
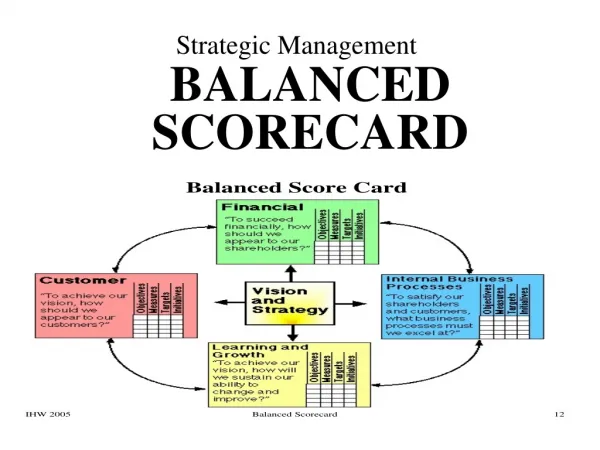
Exh. 10-11 Performance Measures Financial Has our financialperformance improved? What are ourfinancial goals? What customers dowe want to serve andhow are we going towin and retain them? Vision and Strategy Customer Do customers recognize thatwe are delivering more value? Internal Business Processes Have we improved key business processes so that we can deliver more value to customers? What internal busi-ness processes arecritical to providingvalue to customers? The Balanced Scorecard: From Strategy to Performance Measures Learning and Growth Are we maintaining our abilityto change and improve?
http://www.managerialaccounting.org/Balanced%20Scorecard.htm
Translates a company’s mission and strategy into a comprehensive set of performance measures • Financial and nonfinancial aspects The Balanced Scorecard
Who are your stakeholders? • What do your stakeholders need? What are their strategic goals? • Create a Strategy Map-identify your priorities • Consider the four perspectives-Business Processes, Customer Relationship, Education and Growth, and Finance How to define strategic goals
strategy map view • articulates the strategy in a series of linked objectives representing the most important priorities for the organization • scorecard view • Gives specific measures and targets • represent the yardstick and expected level of success • the strategic initiatives or action programs that are the ways to achieve targets outside of current capabilities. Elements http://www.lenskold.com/content/articles/rigatuso_aug07.html
The Learning & Growth Perspective • includes employee training and corporate cultural attitudes related to both individual and corporate self-improvement • The Business Process Perspective • refers to internal business processes • The Customer Perspective • the importance of customer focus and customer satisfaction in any business • Lead indicators • The Financial Perspective Perspectives Robert S. Kaplan and David P. Norton, “Using the Balanced Scorecard as a Strategic Management System,” Harvard Business Review (January-February 1996): 76.
Organization & Learning: people, teams, training and recruiting • Internal Process: business process, automation, technology & plant infrastructure • Customer: marketing, value proposition, and product/service in the eyes of the customer • Financial: revenue, growth, earnings, corporate governance, shareholder value Perspectives of BSC
Modern BSC http://www.ap-institute.com/resources_whitepapers.asp
http://www.torontospin.com/torontospin/events/doc/presentations/20041124-MarkKozak-Holland.pdfhttp://www.torontospin.com/torontospin/events/doc/presentations/20041124-MarkKozak-Holland.pdf
http://www.torontospin.com/torontospin/events/doc/presentations/20041124-MarkKozak-Holland.pdfhttp://www.torontospin.com/torontospin/events/doc/presentations/20041124-MarkKozak-Holland.pdf
http://www.torontospin.com/torontospin/events/doc/presentations/20041124-MarkKozak-Holland.pdfhttp://www.torontospin.com/torontospin/events/doc/presentations/20041124-MarkKozak-Holland.pdf
historical internal (company) data (from operational systems) • historical external data (from third parties) • forecast external data (from third parties) • forecast company internal data (financial and non-financial) • target values (eg EPS targets, Sales Quotas, etc) • Data availability – existing vs. to be collected Data
Decreed by executive management • Negotiated between the operational and line management • Selected from an industry benchmark • Selected from competitors known (or assumed) values • Selected as % change over last years historical value Target values
Key Performance Indicators • reflect the critical success factors of an organization • mustbequantifiable • stay with the same definition from year to year • set targets for each Key Performance Indicator • identify everything that is easy to measure and count • collect and report the data on everything that is easy to measure and count Key Performance Indicators
help organizations understand how well they are performing in relation to their strategic goals and objectives • Show whether the organization is on track or not • serve to reduce the complex nature of organisational performance to a small number of key indicators Key Performance Indicators (KPIs)
Good Key Performance Indicators vs. Bad • Bad: • Title of KPI: Increase Sales • Defined: Change in Sales volume from month to month • Measured: Total of Sales By Region for all region • Target: Increase each month • What needs to be corrected? • Good: • Title of KPI: Employee Turnover • Defined: no of employees resigned + no of employees terminated due to performance number of employees at the beginning of the year • Measured: information available at human resources • Target: Reduce Employee Turnover by 5% per year Example KPI
Who should design your indicators? • Strategist and a line manager • Do you have good indicators? • indicators should not repeat each other, but taken together, they should describe 90% of your company or business unit • Are your indicators easy to measure? • should be easy to understand and measure • How many indicators? • three or four indicators in each category. If you have more, you are overloading your scorecard Key performance indicators and BSC
Marr, B. (2010) How to design Key Performance Indicators, Management Case Study, The Advanced Performance Institute (www.ap-institute.com). http://www.ap-institute.com/downloads/100608%20How%20to%20design%20Key%20Performance%20Indicators.pdf
Type of data • Raw • Progress • Change • Source of data • Frequency of data • Target performance • graphs KPI
http://www.enterprise-dashboard.com/2007/04/05/difference-between-balanced-scorecard-and-enterprise-dashboard/http://www.enterprise-dashboard.com/2007/04/05/difference-between-balanced-scorecard-and-enterprise-dashboard/
Culture change • Human resources • tasks, responsibilities • Performance appraisal, bonuses • Measurement and data collection • Information management Effect on the organization
http://www.scorecardtrainings.com • http://www.balancedscorecard.org • http://www.bscdesigner.com Some sources
1. Recruitment KPI 2. Training KPI 3. Health and safety KPI 4. Performance KPI 5. Employee loyalty KPI 6. Working time KPI 7. HR efficiency KPI 8. Compensation KPI 9. Labor relation KPI 10. Regulation compliance KPI 11. Employee satisfaction KPI • Attitude about compensation and benefits.• Attitude about coworkers.• Attitude about supervisors / managers.• Attitude about promotions, training.• Attitude about work tasks. 12. HR budget KPI 13. Job leaving KPI • 1. Job leaving ratio per year. • 2. Job leaving ratio per department. • 3. Average age of employees that retire. • 4. Percentage of early retirements 14. Workforce information KPI http://www.humanresources.hrvinet.com/recruitment-key-performance-indicators-kpi/ Human Resource KPI
1. Customer care KPI Customer care KPIs include KPIs such as frequency impact to customers, the rate of service charges / profits etc. 2. Customer appraisal KPI They are KPIs related to appraisal customer such as number of new customers, average sale per VIP customer etc. 3. Complaints of customer KPI They include KPIs such as Complaints are resolved in the first time, the rate of complaints by sector etc. 4. Market share KPI They are KPIs related to market share of company such as market share of the company compared with the entire market, relative market share etc. 5. Customer loyalty KPI These KPIs measure customer loyalty of company. Some KPIs are total customer lost, the rate of lost customers lost after purchasing first time etc. 6. Shops and supermarkets KPI Some KPI of this sector such as the rate of profit / per shop, sales turnover / location. These KPIs measure effectiveness of sale channel of shop or supermarket. 7. Sales contact by telephone KPI These ratios relate to effectiveness of contacting by telephone of salesman. 8. Sales rep KPI These ratios relate to effectiveness of sales representative staff such as the rate of response / total sent, time to answer a request by customers. http://www.humanresources.hrvinet.com/sales-kpi/ Sales KPI
1. Public relations KPI PR KPI include KPIs related to appraisal indicators of Public relations such as effective PR items, press releases, conducting survey, the level of awareness of the enterprise through the public relations did etc. 2. Promotion KPI Promotion KPI include KPIs related to appraisal indicators of promotion activities in marketing such as the rate of sales in promotion period and before the promotion, percentage of sales in promotion and after promotion etc. 3. Advertisement KPI Advertisement KPI include KPIs related to appraisal indicators of advertisement activities in marketing such as the cost of advertising on the 1000 target audiences, the level of awareness of the product etc. 4. E-marketing KPI E-marketing KPI include KPIs related to appraisal indicators of E-marketing in marketing such as the rate of new visitors, number of page views / visitors etc http://www.humanresources.hrvinet.com/marketing-kpi/ Marketing KPI
1. Manufacturing cycle time Measured from the Firm Planned Order until the final production is reported. It usually takes into account the original planned production quantity verses the actual production quantity. 2. Defects per million opportunities (DPMO) DPMO is a Six Sigma calculation used to indicate the amount of defects in a process per one million opportunities. Calculation: Total Number of Defects / Total Number of Opportunities for a Defect. Then multiply the answer by 1 Million. 3. Average production costs of items Average production costs of items produced within measurement period. 4. Mean-time between failure (MTBF) The average time between equipment failures over a given period i.e. the average time a device will function before failing. It is the reliability rating indicating the expected failure rate of equipment. 5. Loss ratio of material per order This is lost ratio of material per order. The rate is usually 3 – 5% custom types orders. 6. Rate of material defect by causes of material itself By total material defect due to the nature of that material, measured by the number and value of money. 7. Rate of damaged material by error of workers By total material damage because of worker error, measured by the number and/or value of money. 8. Scrap value % Scrap value as a percentage of production value General production KPIs http://www.humanresources.hrvinet.com/production-kpi/
1. Delivery on time • Formula: the number of delivery on time / total delivery.• Apply this formula to each provider and entire company every month. 2. Delivery is not enough quantity, quality • Formula: with the total number of delivery with enough quality/ quantity / the number of total delivery . 3. Quantity bought over required • This rate determine the number of products using in actual in comparison with quantity planned.• This rate determines the effectiveness of the purchasing order.• The rate may be identified in quantity or money. 5. Purchasing cost • By value of purchasing / sales value• Compare this with the percentage rate as planned. 6. Cost of purchasing units • This rate is total purchase cost / total sales. 7. Transaction cost unit of purchasing • Formula = (Total cost of purchasing – a total cost of goods) / sales turnover.• You can compare this rate with different goods in order to view transaction costs a high or low 8. Suppliers rating. • Number of suppliers accounting for 80% of the value of goods• The number of suppliers of goods per year• Number of suppliers be removed per year..• Number of new suppliers per year.. Purchasing / Procurement KPI http://www.humanresources.hrvinet.com/purchasing-procurement-kpi/
General Financial KPIs 1. Weighted Average Days Paid Weighted Average Days Paid in Receivables Management 2. Weighted Average Days Past Due Average days past due for open AP invoices weighted by open amount 3. Weighted Days Delinquent Sales Outstanding Weighted Days Delinquent Sales Outstanding in Receivables Status dashboard 4. Weighted Terms Outstanding Weighted Terms Outstanding in Receivables Status dashboard 5. Receipts Amount Receipts Amount in Receivables Management 6. Revenue (P&L) Revenue KPI in Profit and Loss Analysis Dashboard 7. T&E per Head Travel and entertainment expenses / Headcount 8. Total Receipts Total Receipts (Rolling 30 Days) in Receivables Status dashboard 9. Unapplied Receipts Unapplied Receipts Amount 10. Weighted Average Days Due Sum of days until due weighted by invoice amount for open AP invoices Financial KPI http://www.humanresources.hrvinet.com/financial-kpi/
1. Operating income: Operating Income equals Gross Profit minus SG&A Expenses. It is the income from current operations. 2. Gross profit: Gross Profit equals Revenue minus Cost of Goods Sold. It identifies the amount available to cover other operating expenses. 3. Gross profit margin: Gross Profit Margin equals Gross Profit divided by Revenue, expressed as a percentage. 4. Cost of goods sold (COGS): Cost of Goods Sold includes all expenses directly associated with the production of goods or services the company sells (such as material, labor, overhead, and depreciation). It does not include SG&A. 5. Operating margin: Operating Margin equals Operating Income divided by Revenue, expressed as a percentage. 6. Goodwill: Goodwill is an accounting term used to reflect the portion of the book value of a business entity not directly attributable to its assets and liabilities. 7. Total Assets: Total Assets are everything of value that is owned by a company. 8. Accounts Payable: Money owed (payable) to suppliers for goods or services purchased on credit that must be paid within a year. 9. Long-Term Debt: Long-Term Debt represents the amount of borrowings due more than one year from the date of the balance sheet. 10. Total Liabilities: Total liabilities represent the sum of all monetary obligations of a business and all claims creditors have on its assets. 11. Cumulative Annual Growth Rate (CAGR): 12. Cash Flow Return on Investments (CFROI): This is similar to ROI, but the only difference is CASH is used inplace of Profit. 13. SG&A expenses: Selling, General, and Administrative Expenses include all salaries, indirect production, marketing, and general corporate expenses. 14. Net profit margin: Net Profit Margin equals the Total Net Income divided by Revenue, expressed as a percentage. 15. Shares Outstanding: Shares Outstanding is the outstanding number of shares of the class of common stock that is most actively traded. General Accounting KPIs
16. Total Equity: Total Equity equals Preferred Stock Equity + Common Stock Equity. 17. Total Current Assets: Total Current Assets equals Cash and Equivalents + Receivables + Inventories + Other Current Assets. 18. Other Current Assets: Other Current Assets includes prepayments, deferred charges, and amounts (other than trade accounts) due from parents and subsidiaries. 19. Inventories: Inventories is merchandise bought for resale or supplies and raw materials purchased for use in revenue producing operations. 20. Net Receivables: Net Receivables are amounts owed to the company, net of any provisions for bad debts. 21. Cash: Cash consists of cash and may include cash-like items such as short-term investments that can be quickly converted to cash. 22. Net Change in Cash: Net Change in Cash is the difference between the Cash and Cash Equivalents at the beginning of the reporting period minus the amount at the end of the reporting period. 23. Common Stock Equity: Common Stock Equity is the amount of shareholders’ equity attributable to common stock. 24. Preferred Stock Equity: Preferred Stock Equity is the amount of shareholders’ equity attributable to the preferred stock issued by the parent company. 25. Other Noncurrent Liabilities: The liabilities that are not assigned to Long-Term Debt or deferred Income Taxes. 26. Short-Term Debt: Short-Term Debt represents the amount of borrowings (principal and interest) that must be paid in the near future. 27. Other Noncurrent Assets: Assets that are not assigned to Net Fixed Assets or intangibles. 28. Total Current Liabilities: Total Current Liabilities equals Accounts Payable + Short-Term Debt + Other Current Liabilities. 29. Other Current Liabilities: Other Current Liabilities includes all other liabilities not assigned to Short-Term Debt or Accounts Payable. 30. Net Fixed Assets: Net Fixed Assets are the assets of a company that are of a relatively permanent nature and are not intended for resale, such as property, plants, and equipment. General Accounting KPIs http://www.humanresources.hrvinet.com/sample-kpi/