Logical Models
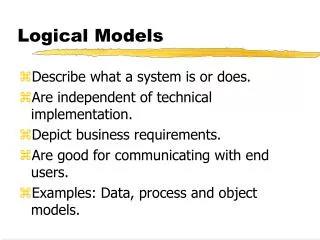
Logical Models. Describe what a system is or does. Are independent of technical implementation. Depict business requirements. Are good for communicating with end users. Examples: Data, process and object models. Data Modeling. A technique for organizing and documenting a system’s data.

Logical Models
E N D
Presentation Transcript
Logical Models • Describe what a system is or does. • Are independent of technical implementation. • Depict business requirements. • Are good for communicating with end users. • Examples: Data, process and object models.
Data Modeling • A technique for organizing and documenting a system’s data. • Sometimes called database modeling or information modeling. • The basic tool for data modeling is called an entity-relationship diagram (ERD).
Entity Relationship Diagrams (ERDs) • Three basic elements: • Entity types - the kinds of things the information system collects information about. • Relationship - the way an entity type is associated with another. • Attributes - specific information about an entity type.
Has Office Professor One-to-one relationship Teaches Professor Section One-to-many relationship Optional one-to-many relationship Has Section Course Is registered in Many-to-many relationship Student Section Types of relationships in entity-relationship Source: Alter S. (1999), Information Systems: A Management Perspective, Third Edition ERDs
Offers Department Course Has Is registered in Student Teaches Professor Section Has Office Entity - Relationship Diagram for part of a university registration system Source: Alter S. (1999), Information Systems: A Management Perspective, Third Edition Entity Relationship Diagram Belongs to
Process Modeling • A technique for organizing and documenting • the structure and flow of data through a system’s processes and/or • the logic, policies, and procedures to be implemented by a system’s processes. (Whitten and Bentley 1998) • Tools: data flow diagrams (DFD) and IDEF0
Data Flow Diagrams (DFDs) • Four basic symbols: • Process - transforms inputs into outputs. • External entity - any person or organization that provides data to a process in the system or receives data from a process. Process External Entity
Data Flow Diagrams (DFDs) • Data store - a location where data is stored. • Data flow - represents movement of data between processes, data stores and external entities. Data Store Data Flow
Creating DFDs • Starting point is a context diagram, which verifies the scope of the system by showing the sources and destinations of data used and generated by the system. • System represented as a single process is at the center of the context diagram. • Surrounding that process are external entities and external data stores.
Creating DFDs (contd.) • The business process in the context diagram is broken into its constituent processes to describe exactly how work is done. • These constituent processes along with the data stores, external entities and data flows constitute the top level data flow diagram.
Creating DFDs (contd.) • Constituent processes can be broken into sub-processes. • DFDs make it possible to look at business processes at any level of detail. • In addition to the context diagram, one or more DFDs are developed based on the level of detail required.
Order Supplier Material Planning Payment Department PURCHASING Material requirement Invoice SYSTEM Confirmation of receipt Receiving Department Context diagram for the Ford purchasing system Source:Alter S. (1999), Information Systems: A Management Perspective, Third Edition Purchasing system - Context diagram
Order material PCH 1 Purchase order Material requirement Material Planning Department Purchase order Purchase order details Decide what to pay PCH 2 Purchase Orders Supplier Invoice Receipt Confirmations Receipt details Receipt confirmation Payment authorization Pay the supplier PCH 3 Receiving Department Payment Data flow diagram showing the main processes in Ford’s original purchasing system Source:Alter S. (1999), Information Systems: A Management Perspective, Third Edition Purchasing System - Data Flow Diagram
Integration Definition for Function (IDEF) • Background • Integrated Computer Aided Manufacturing (ICAM) program in US Air Force developed the IDEF series of techniques to improve manufacturing productivity. • IDEF0 - Function model, IDEF1 - Information model, IDEF2 - Dynamic model. • IDEF techniques widely used in government/industrial sectors.
IDEF0 Concepts • Technique for performing and managing needs analysis, benefits analysis, requirements definition, functional analysis, and systems design. • Reflects how system functions interrelate and operate.
IDEF0 Semantics • Box - Function (Ex. Perform Inspection) • Left arrow - Inputs (Ex. Design data) • Top arrow - Controls (Ex. Design requirements) • Bottom arrow - Mechanisms (Ex. Design Engineer) • Right arrow - Output (Ex. Detailed design)
Control Requirements Input Output FUNCTION Design data Detailed design DESIGN Mechanism Engineer IDEF0 Semantics (contd.)
IDEF0 Diagrams • IDEF0 models composed of: graphic diagrams, text, and glossary. • Boxes representing a function can be broken down or decomposed into more detailed diagrams. • Top level diagram in the model provides the most general description, with details provided in the lower levels.
Purchasing System - Context diagram Policies and procedures Material requirements Purchase Order Invoice PURCHASING SYSTEM Payment Confirmation of receipt Resources
Material requirements Purchase order ORDER MATERIAL DETERMINE PAYMENT Payment authorization Receipt details Invoice PAY THE SUPPLIER Payment Purchasing System - IDEF Diagram
Data Warehouses • Used for building the data management infrastructure for DSSs and EISs. • A database (or collection of databases) that is optimized for decision support. • Populated through the extraction and integration of data from both operational and external data sources.
Warehouse Architecture • Three types of components • the platform and software (including the repository) that house the data warehouse, • the data acquisition software or back end, which extracts data, consolidates and summarizes the data, and loads the data into the data warehouse, and • the client or front end software, which allows users to access and analyze data.
Role of the Repository • Technical role - to support the building and maintenance of the data warehouse. • document data sources and targets • data transformation and cleanup rules • interface to CASE tools • document warehouse data model • Business-related role - to support end users in accessing and analyzing data.
Data Marts • Data stores specific to user-communities. • Examples are • EIS server for executives • DSS servers for departments (marketing, finance, and manufacturing) • Data is structured in the form of a multi-dimensional database.
Multidimensional Analysis • An analytical technique that allows users to view data in a dimensional cube format. • Users can perform operations such as drill-down, roll-up, slice and dice, and data pivoting. • Another term for multidimensional analysis is on-line analytical processing (OLAP).
Multidimensional Database • Relational structure - data is stored in a tabular form and is not preprocessed. Slow performance is an issue. • Star structure - two types of tables are used, fact and dimension. A “virtual” cube representation. • Multidimensional database - preprocessed data stored in the form of arrays.
MOLAP and ROLAP • MOLAP is OLAP with a multidimensional database. • ROLAP or relational OLAP allows access to the data without building a specific multidimensional database. • MOLAP is suited for analysis on data marts in a multi-user environment.