Download
1 / 27
270 likes | 370 Vues
Learn about the National Assessment of Educational Progress (NAEP) tests, its purpose, results provided, and how it impacts education policy and student performance. Explore the importance of standardized assessment in tracking academic progress over time.

E N D
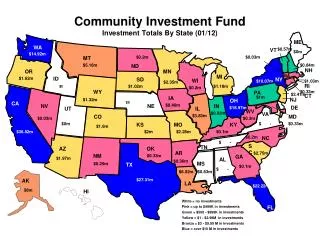
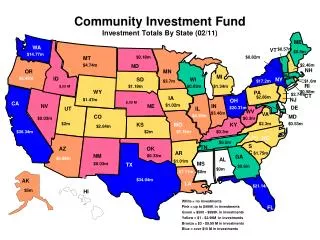
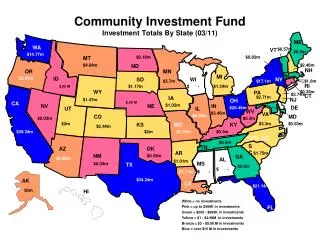
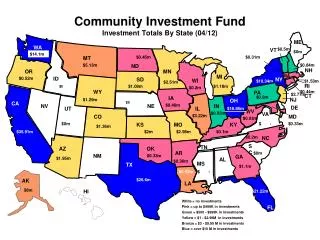
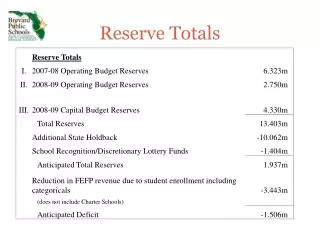
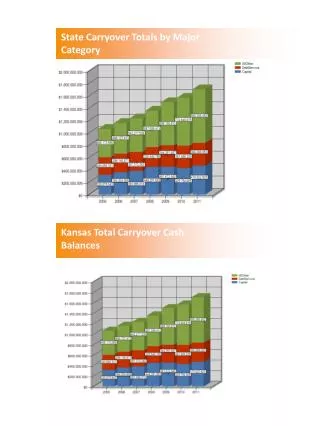
State Carryover Totals by Major Category Kansas Total Carryover Cash Balances
Spending Per-pupil Kansas State Spending Per-pupil Blue Valley Spending Per-pupil Shawnee Mission Spending Per-pupil Kansas City Kansas Spending Per-pupil
Per-pupil Revenue Kansas State Average Per-pupil Revenue Blue Valley Revenue Per-pupil Shawnee Mission Revenue Per-pupil Kansas City Kansas Revenue Per-pupil
What are the NAEP tests? • NAEP: A Common Yardstick • The National Assessment of Educational Progress (NAEP) is the largest nationally representative and continuing assessment of what America's students know and can do in various subject areas. Assessments are conducted periodically in mathematics, reading, science, writing, the arts, civics, economics, geography, and U.S. history. • Since NAEP assessments are administered uniformly using the same sets of test booklets across the nation, NAEP results serve as a common metric for all states and selected urban districts. The assessment stays essentially the same from year to year, with only carefully documented changes. This permits NAEP to provide a clear picture of student academic progress over time. • What NAEP Does—and Doesn't—Report • NAEP provides results on subject-matter achievement, instructional experiences, and school environment for populations of students (e.g., all fourth-graders) and groups within those populations (e.g., female students, Hispanic students). NAEP does not provide scores for individual students or schools, although state NAEP can report results by selected large urban districts. NAEP results are based on representative samples of students at grades 4, 8, and 12 for the main assessments, or samples of students at ages 9, 13, or 17 years for the long-term trend assessments. These grades and ages were chosen because they represent critical junctures in academic achievement. • There are two NAEP websites: one dealing with the different components of the NAEP assessment and one presenting the results. When NAEP results are reported, they become part of "The Nation's Report Card." To find results from a particular assessment quickly, use the table at The Nation's Report Card website. • Who Runs NAEP • The Commissioner of Education Statistics, who heads the National Center for Education Statistics in the U.S. Department of Education, is responsible by law for carrying out the NAEP project. The National Assessment Governing Board, appointed by the Secretary of Education but independent of the Department, sets policy for NAEP and is responsible for developing the framework and test specifications that serve as the blueprint for the assessments. The Governing Board is a bipartisan group whose members include governors, state legislators, local and state school officials, educators, business representatives, and members of the general public. Congress created the 26-member Governing Board in 1988. The NAEP assessment operations are carried out with assistance from contractors. • *Visit http://nces.ed.gov/nationsreportcard/about/ for more information. • *Please note in the graphs below Kansas state tests are made up by the state. • *Florida instituted education reforms in 1999.
NAEP Reading Proficiency-4th Grade- African American Vs. Kansas 4th Grade Reading
NAEP Reading Proficiency- 4th Grade-Hispanic Vs. Kansas 4th Grade Reading
NAEP Reading Proficiency-4th Grade- White Vs. Kansas 4th Grade Reading
NAEP Reading Proficiency-4th Grade- Low Income Vs. Kansas 4th Grade Reading
NAEP Reading Proficiency- 4th Grade-All Vs. Kansas 4th Grade Reading
NAEP Reading Proficiency-8th Grade- African American Vs. Kansas 8th Grade Reading
NAEP Reading Proficiency-8th Grade- Hispanic Vs. Kansas 8th Grade Reading
NAEP Reading Proficiency-8th Grade- White Vs. Kansas 8th Grade Reading
NAEP Reading Proficiency-8th Grade- Low Income Vs. Kansas 8th Grade Reading
NAEP Reading Proficiency- 8th Grade-All Vs. Kansas 8th Grade Reading
NAEP Math Proficency-4th Grade- African American Vs. Kansas State 4th Grade Math
NAEP Math Proficency-4th Grade- Hispanic Vs. Kansas State 4th Grade Math
NAEP Math Proficency-4th Grade- White Vs. Kansas State 4th Grade Math
NAEP Math Proficency-4th Grade- Low Income Vs. Kansas State 4th Grade Math
NAEP Math Proficency-4th Grade- All Vs. Kansas State 4th Grade Math
NAEP Math Proficency-8th Grade- African American Vs. Kansas State 8th Grade Math
NAEP Math Proficiency- 8th Grade- Hispanic Vs. Kansas State 8th Grade Math
NAEP Math Proficiency-8th Grade- White Vs. Kansas State 8th Grade Math
NAEP Math Proficiency-8th Grade- Low Income Vs. Kansas State 8th Grade Math
NAEP Proficiency-8th Grade- All Vs. Kansas State 8th Grade Math
Why Florida’s Education Reform Works • The simple principles of Florida’s education reform are: • Holding schools accountable for results; • Setting high expectations; • Fostering and Rewarding success; • Giving families real school choice; • Attracting talent into the classroom; • For more information on Flordia’s education reforms visit: http://www.excelined.org/Docs/A%20Summary%20of%20Florida's%20Education%20Revolution.pdf
Results of Florida's A+ Plan: School Grades in 1999 & 2010 *Graphs on this page courtesy of Foundation for Excellence in Education
*Graphs on pages 1-33 courtesy of kansasopengov.org *Flordia graphs and article courtesy of Foundation for Excellence in Education, more information at http://www.excelined.org/Docs/A%20Summary%20of%20Florida's%20Education%20Revolution.pdf