Download
1 / 7
70 likes | 227 Vues
Figure 5.2. A. "Barcode" magnitude representations. Alternative schemes for representing numerical magnitude: A. Barcode magnitude representation (Viscuso et al., 1989; Anderson et al., 1994; McCloskey & Lindemann, 1992). B. Numerosity code (Zorzi & Butterworth, 1999).

E N D
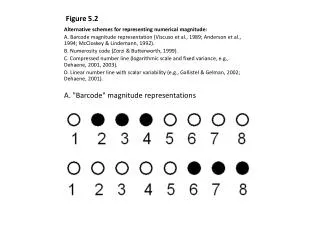
Figure 5.2 A. "Barcode" magnitude representations Alternative schemes for representing numerical magnitude: A. Barcode magnitude representation (Viscuso et al., 1989; Anderson et al., 1994; McCloskey & Lindemann, 1992). B. Numerosity code (Zorzi & Butterworth, 1999). C. Compressed number line (logarithmic scale and fixed variance, e.g., Dehaene, 2001, 2003). D. Linear number line with scalar variability (e.g., Gallistel & Gelman, 2002; Dehaene, 2001).
B. Numerosity magnitudes Cont Figure 5.2 C. Compressed number line
Cont Figure 5.2 D. Number line with scalar variability
Figure 6.13 Spike density functions for a cell that was selective for visual displays with three elements. The colored lines illustrate the time course of neuronal activity for the five tested numerosities. Grey shadowing indicates the period for which the sample was present. Reprinted from Nieder, Freedman, & Miller, 2002.
Figure 24.3 Brain areas activated during complex calculation (Green: common to expert and nonexperts; Red: expert only. Adapted from Pesenti et al. 2001; image courtesy of N. Tzourio-Mazoyer).
Figure 25.1 Regions of overlapping activity for three groups of studies, superimposed on axial and sagittal slices of a normalized single-subject anatomical image. The overlap was calculated by averaging binarized contrast images indicating which voxels were significant for a given contrast (studies and contrasts are listed in Table 25.1). The color scale indicates the percentage of studies showing activation in a given voxel. The same color scale (from 22 to 50% of overlap) is applied to all images. Although no single voxel was shared by 100% of studies in a group, probably due variability across groups of subjects, laboratories, and imaging methods, Table 25.1 revealed a high consistency of activations. (A) The horizontal segment of the intraparietal sulcus (HIPS) was activated bilaterally in a variety of contrasts sharing a component of numerical quantity manipulation. The barycenter of the region of maximum overlap (> 50%) was at Talairach Coordinates (TC) 41, -42, 49 in the left hemisphere, and -48, -41, 43 in the right hemisphere. Activation overlap is also visible in the precentral gyrus. (B) The angular gyrus (AG) was activated with a strong left lateralization (TC -48, -59, 30), and activated in 4/5 studies. Posterior cingulate as well as superior frontal regions also show some degrees of overlap. (C) The posterior superior parietal lobule (PSPL) was activated bilaterally in a few numerical tasks (left and right barycenters at TC -26, -69, 61 and 12, -69, 61; and see Table 25.1). To emphasize the non-specificity of this region, the image shows the intersection of the overlap between four numerical tasks with an image of posterior parietal activity during a non-numerical visual attention shift task (Simon et al., 2002).
Figure 25.2 Three-dimensional representation of the parietal regions of interest. For a better visualization of each maximal overlap, the clusters show all parietal voxels activated in at least in 40% of studies in a given group. Note that this is a transparent brain view, and that the HIPS clusters are actually located deep in the intraparietal sulcus. The inset shows the localization of the intraparietal site where number neurons were identified in the macaque monkey, and which may be homologous to the human HIPS. CS, central sulcus; IPS, intraparietal sulcus.