VISUAL LITERACY
VISUAL LITERACY. BAYA. SIRAJUN. NISSHAK. ‘ALYAA. MI’GHE. PAEI. HIDAYAH. DIANA SYAKILA SYAZANI HANOOM. SHAZLIN. ZILA. AZREEN. WHAT IS VISUAL LITERACY?. The ability to look at visual information with perception. (www.pbs.org )

VISUAL LITERACY
E N D
Presentation Transcript
VISUAL LITERACY BAYA SIRAJUN NISSHAK ‘ALYAA MI’GHE PAEI HIDAYAH DIANA SYAKILA SYAZANI HANOOM SHAZLIN ZILA AZREEN
WHAT IS VISUAL LITERACY? • The ability to look at visual information with perception. (www.pbs.org ) • Visual literacy is something learned, just as reading and writing are learned.
It is very important to have the ability to process visual images efficiently and understand the impact they have on viewers. • The lessons in this section provide teachers with a starting point in the learning process.
VL is the set of skills involved in • The interpretation and criticism of images. • It is a field of study in academic, drawing on art history and criticism. • An information design and graphic design. • It is also a goal of education paralleling linguistic literacy.
The basic skills of visual literacy include the vocabulary of concepts necessary for understanding and discussing images. • Visual literacy can also include rhetorical analysis of the ways different media convey their arguments or messages visually.
In today's modern world, we are bombarded with visual images on the roadway, on television, at the computer screen, and photographs and other visual images in paper publications. Some of the images are designed to guide us, such as road signs etc. To make live easier. Other images, such as advertising, are designed to manipulate our feelings.
Images can be refers to any photographs, graphs, charts, diagrams, technical illustrations, conceptual models, etc. Which have underlie meaning.
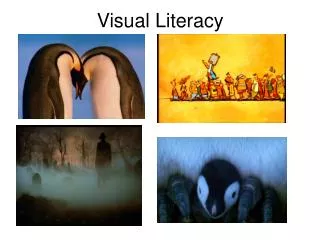
Vampire • Death • Dracula • Festive season • Christmas • snow • Islam • Place for prayer • Muslim • Lost • Confuse • Crossroad. People can/free to associate the above pictures according to their own interpretations.
GOOD VISUAL AIDS • enhance the presentation by reinforcing concepts, illustrating ideas, and stimulating interest • support a lecture
ROLES OF VISUAL LITERACY • Encourage student participation • Help students grasp difficult concepts. • Still graphics allow the learner to acquire and retain visual images.
ROLES OF VISUALS IN INSTRUCTION • Help to direct the audience’s attention • Help the instructor to keep on time and on topic • Help to assure audience comprehension
PRINCIPLE IN PRODUCTION
SYMPLE TYPE STYLE HORIZONTAL FORMAT P LEGIBLE UNCOMPLICATED
LEGIBLE Most non-projected set-ups, including chalkboards, marker boards, charts, posters and three dimensional must be legible to pupils UNCOMPLICATED Subdivide complex information to make two or more simple visuals.
SYMPLE TYPE STYLE avoid using all capital letters, and confine written material to a length and width that will enable adequate enlargement for projection. HORIZONTAL FORMAT so the image can be projected larger and placed higher on the screen for easier viewing
Principles in Producing Visuals • Show only RELEVANT information via graphics and photographs. • Use "progressive disclosure" to present complex information and prevent confusion. • Make them as uncomplicated as possible.
Principles in Producing Visuals • Include arrows, circles, labels, or other highlights to draw attention to important areas. • Use color appropriately to highlight or aid in discrimination. Too many colors in a visual can be distracting.
APPLICATION OF VISUALS MEDIA 1. MASS INSTRUCTION 2.INDIVIDUALISED LEARNING 3.GROUP LEARNING
MASS INSTRUCTION • visual aids during expository teaching • entirely supportive. • delivered to classes of up to several hundred • have relatively limited usefulness
INDIVIDUALISED LEARNING • can be used in a wide range of self-instructional situations • In most cases, such materials play a key role in the instruction process by providing the actual objects of study
GROUP LEARNING • play a useful supportive role in group-learning situations • Eg, 1.by providing visual aids during presentation/discussion-type activities as seminars and tutorials, or 2. providing the subject matter for small-group exercises.
CHALKBOARDS AND MARKERBOARDS ADHESIVE DISPLAYS VARIOUS NON- PROJECTED MEDIA Three-dimensional display materials Charts, posters and similar flat displays.
The Chalkboard • Speed: We write on the board at about the same speed with which we comprehend information, so using a chalkboard helps set an effective pace for learning. • Organization: You can outline the day’s agenda or summarize main points and refer back to these to integrate your ideas and give the class a sense of progress.
TheChalkboard • Visuals: The board lends itself well to working on formulas, solving problems drawing graphs, and diagramming sentences. • Interaction: The board is also helpful in generating interaction with students, as you can use it to ask for ideas, make lists (and even laugh at your occasional spelling mistakes).
ADHESIVE DISPLAYS • those where display material is stuck to the display surface in some way (other than by drawing pins or glue). • Eg, feltboards, hook-and-loop boards and magnetic boards,
Charts, posters and similar flat displays. Charts and wall charts Charts and wall charts flipchart Lamination Posters
Display Boards • o Check for visibility • o Plan board use in advance • o Use drawing aids or guidelines • o Print rather than write in script • o Talk to your students, not the board • o Move around
Text Checklist • o Use textbooks to meet student needs • o Encourage students to use reading comprehension methods - SQ3R is one example • o Use objectives and/or questions
Utilization of Objects & Models • o Familiarize yourself with the object of model • o Make sure objects are large enough to be seen • o Show objects only when needed • o Represent size, color, etc., with models • o Avoid passing a single object around class
Three-dimensional display materials • Mobiles • Models • Dioramas • Realia
MOBILES A three-dimensional wall chart in which the individual components can move about. drawn on card or stencilled on metal, cut out or moulded, and hung independently from the roof (or a suitable beam) using fine threads. MODELS three-dimensional representations of real things or abstract systems) visual support materials in mass instruction, as objects for study or manipulation in individualised learning, and as construction projects
DIORAMAS a three-dimensional foreground of model buildings, figures etc. with a two-dimensional painted background, thus creating a highly-realistic effect Eg, Architecture, geography and geology (representations of buildings, towns, landscapes, pre-historic landscapes and scenes, etc.). REALIA The supreme instructional 'model' When studying geology, for example, there are few satisfactory substitutes for actually handling and examining real rock specimens,