DNA/Protein structure-function analysis and prediction
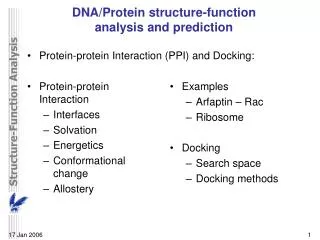
Protein-protein Interaction (PPI) and Docking: Protein-protein Interaction Interfaces Solvation Energetics Conformational change Allostery. Examples Arfaptin – Rac Ribosome Docking Search space Docking methods. DNA/Protein structure-function analysis and prediction.

DNA/Protein structure-function analysis and prediction
E N D
Presentation Transcript
Protein-protein Interaction (PPI) and Docking: Protein-protein Interaction Interfaces Solvation Energetics Conformational change Allostery Examples Arfaptin – Rac Ribosome Docking Search space Docking methods DNA/Protein structure-function analysis and prediction
PPI Characteristics • Universal • Cell functionality based on protein-protein interactions • Cyto-skeleton • Ribosome • RNA polymerase • Numerous • Yeast: • ~6.000 proteins • at least 3 interactions each • ~18.000 interactions • Human: • estimated ~100.000 interactions • Network • simplest: homodimer (two) • common: hetero-oligomer (more) • holistic: protein network (all)
Interface Area • Contact area • usually >1100 Å2 • each partner >550 Å2 • each partner loses ~800 Å2 of solvent accessible surface area • ~20 amino acids lose ~40 Å2 • ~100-200 J per Å2 • Average buried accessible surface area: • 12% for dimers • 17% for trimers • 21% for tetramers • 83-84% of all interfaces are flat • Secondary structure: • 50% a-helix • 20% b-sheet • 20% coil • 10% mixed • Less hydrophobic than core, more hydrophobic than exterior
Complexation Reaction • A + B AB • Ka = [AB]/[A]•[B] association • Kd = [A]•[B]/[AB] dissociation
Experimental Methods • 2D (poly-acrylamide) gel electrophoresis mass spectrometry • Liquid chromatography • e.g. gel permeation chromatography • Binding study with one immobilized partner • e.g. surface plasmon resonance • In vivo by two-hybrid systems or FRET • Binding constants by ultra-centrifugation, micro-calorimetry or competition • experiments with labelled ligand • e.g. fluorescence, radioactivity • Role of individual amino acids by site directed mutagenesis • Structural studies • e.g. NMR or X-ray
Surface Plasmon Resonance 1 • Evanescent field
Surface Plasmon Resonance 2 • sensitivity limit for layer thickness ~0.2-0.4 nm. http://www.biochem.mpg.de/oesterhelt/xlab/spfs.html#monitoring
plasmon curve Reflexion intensity as function of angle of incidence Q dotted line: after addition of adsorbing molecules. kinetics during adsorption process Reflexion intensity as function of time at fixed angle Q. Surface Plasmon Resonance 3
PPI Network http://www.phy.auckland.ac.nz/staff/prw/biocomplexity/protein_network.htm
Protein-protein interactions • Complexity: • Multibody interaction • Diversity: • Various interaction types • Specificity: • Complementarity in shape and binding properties
Binding vs. Localization strong Non-obligatetriggered transient e.g. GTP•PO4- Non-obligatepermanente.g. antibody-antigen Obligateoligomers Non-obligateco-localised e.g. in membrane Non-obligateweak transient weak co-expressed different places
Some terminology • Transient interactions: • Associate and dissociate in vivo • Weak transient: • dynamic oligomeric equilibrium • Strong transient: • require a molecular trigger to shift the equilibrium • Obligate PPI: • protomers not stable structures on their own • (functionally obligate)
Strong – medium – weak • Nanomolar to sub-nanomolar • Kd < 10-9 • Micromolar to nanomolar • 10-6 > Kd > 10-9 • Micromolar • 10-3 > Kd > 10-6 • A + B AB • Kd = [A]•[B]/[AB] dissociation
Analysis of 122 Homodimers • 70 interfaces single patched • 35 have two patches • 17 have three or more
Patches • Cluster in different domains • (structurally defined units often with specific function) two domains anticodon-binding catalytic
Interfaces • ~30% polar • ~70% non-polar
Interface • Rim is water accessible rim core
Interface composition • Composition of interface essentially the same as core • But % surface area can be quite different!
Propensities • Interface vs. surface propensities • as ln(fint/fsurf)
Conformational Change • Chaperones • extreme conformational changes upon complexation • ligand unfolds within the chaperone GroEL/GroES • Allosteric proteins • conformational change at 'active' site • ligand binds to 'regulating' site • Peptides • often adopt 'bound' conformation • different from the 'free' conformation
Allostery 1 • Regulation by 'remote' modulation of binding affinity (complex strength) www.blc.arizona.edu/courses/181gh/rick/energy/allostery.html
Allostery 2 • Substrate binding is cooperative • Binding of first substrate at first active site • stimulates active shape • promotes binding of second substrate
Allostery 3 • Committed step of metabolic pathway • regulated by an allosteric enzyme • Pathway end product • can regulate the allosteric enzyme for the first committed step • Inhibitor binding favors inactive form
Protein-protein Interaction (PPI) and Docking: Protein-protein Interaction Interfaces Solvation Energetics Conformational change Allostery Examples Arfaptin – Rac Ribosome Docking Search space Docking methods DNA/Protein structure-function analysis and prediction
Small G-proteins cross-talk • Mediated by Arfaptin
Arfaptin and Rac • Micromolar Kd • But specific
70S structure at 5.5 Å (Noller et al. Science 2001)
30S-50S interface • Overall buried surface area ~8500 Å2 < 37.5 Å2 37.5 Å2 – 75 Å2 > 75 Å2
Protein-protein Interaction (PPI) and Docking: Protein-protein Interaction Interfaces Solvation Energetics Conformational change Allostery Examples Arfaptin – Rac Ribosome Docking Search space Docking methods DNA/Protein structure-function analysis and prediction
Docking - ZDOCK • Protein-protein docking • 3-dimensional (3D) structure of protein complex • starting from 3D structures of receptor and ligand • Rigid-body docking algorithm (ZDOCK) • pairwise shape complementarity function • all possible binding modes • using Fast Fourier Transform algorithm • Refinement algorithm (RDOCK) • top 2000 predicted structures • three-stage energy minimization • electrostatic and desolvation energies • molecular mechanical software (CHARMM) • statistical energy method (Atomic Contact Energy) • 49 non-redundant unbound test cases: • near-native structure (<2.5Å) for 37% test cases • for 49% within top 4
Protein-protein docking • Finding correct surface match • Systematic search: • 2 times 3D space! • Define functions: • ‘1’ on surface • ‘r’ or ‘d’ inside • ‘0’ outside d r
Protein-protein docking • Correlation function: Ca,b,g = 1/N3SoSpSqexp[2pi(oa + pb + qg)/N] •Co,p,q
Docking Programs • ZDOCK, RDOCK • AutoDock • Bielefeld Protein Docking • DOCK • DOT • FTDock, RPScore and MultiDock • GRAMM • Hex 3.0 • ICM Protein-Protein docking • KORDO • MolFit • MPI Protein Docking • Nussinov-Wolfson Structural Bioinformatics Group • …