Download
1 / 39
400 likes | 640 Vues
Haze Cast Site Storyboard. January 18, 2006 Scientific Visualization Susan Reiser, Jim Fox. Kiosk Hierarchy. Attractor Screen. Menu. Haze Forecast. Game. Interface. What is Haze. What is Haze. What Causes Haze. How do we Measure Haze?. What is Haze. What is a Haze Forecast?.

E N D
Haze Cast SiteStoryboard January 18, 2006 Scientific Visualization Susan Reiser, Jim Fox
Kiosk Hierarchy Attractor Screen Menu Haze Forecast Game Interface What is Haze What is Haze What Causes Haze How do we Measure Haze? What is Haze What is a Haze Forecast? How can we Improve?
Primary Functions “CHAPTERS” Attractor Screen What is Haze What is Haze Game What is Haze 1. Hidden button transfers to Menu when the screen is touched. Haze Forecast Menu What Causes Haze • Each category button has a Chapter counter to direct to first chapter in each main section. • Each chapter is called inside the interface, with the exception of the Game and Haze Forecast. What is a Haze Forecast? Interface • The buttons on the bottom of the interface will advance or reverse the chapter called. • Another button returns the user to the menu. • There is a timer in the interface that detects when the user has left the screen. When this occurs, the Attractor screen is restarted. How do we Measure Haze? How can we Improve?
Attractor screen (for kiosk only) • Graphics that go through a sequence that illustrate a basic concept of haze and air quality • A simple Flash animation (intro.swf) • The kiosk accompanies a series of graphics on the wall that applies this directly to Western North Carolina
Menu screen (for kiosk only) • This is just a pointer • A simple Flash animation (menu.swf) • This will go to start of main sections
Interface • Packager for rest of scenes • Screen for visuals • Sidebar for words • Buttons for interactivity
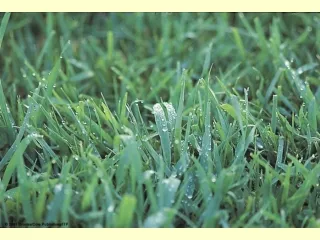
What is Haze (Section 1)WhatIsHaze1Overview • Goals –Introduce the concept of haze and apply it to local area. • Words – “Have you ever noticed a difference in the view while on your favorite hike? Some days you can see for miles, while on others you can hardly see across the valley. Why is that? • Images to use: background, sun, clouds, tree, hiker, river • Possible animations • Sky turning hazy • Clouds moving
What is Haze (Section 1)WhatIsHaze2CloserLook • Goals –Show that particles and other pollution in air cause the haze • Words – “This change in visibility is called haze. Haze is caused by very small particles of pollution, obscuring the color and clarity of what you see.” • Images to use: background, sun, clouds, tree, hiker, river, magnifying glass, molecules • Possible animations • Sky turning hazy • Clouds moving • Magnifying glass pulling onto stage • Molecules vibrating
What is Haze (Section 1)WhatIsHaze3Cough • Goals –These particles cause haze, but also can be harmful to your health. • Words – “If you can see the haze, then you are also breathing in the particles that cause the haze. These particles have been tied to health problems.” • Images to use: background, sun, clouds, tree, hiker, river • Possible animations • Sky turning hazy • Clouds moving • Hiker coughing
What is Haze (Section 1)WhatIsHaze4AcidRain • Goals –Air pollution also impacts the rest of the environment, including causing acid rain • Words – “The particles also fall back to earth and damage the earth, much like acid rain does.” • Images to use: background, sun, clouds, tree, hiker, river • Possible animations • Sky turning hazy • Clouds moving • Rain falling • Fish dying • Tree dying
Section 2 – What Causes Haze (Part 1) • Modules • Air pollution basics, caused by mobile and stationary sources • Two components of pollution, ozone and particulate matter, components of ozone • Types of particulate matter and percentages
What Causes Haze (Section 2)WhatCausesHaze1MobileStationary • Goals – Air pollution basics, with a primary focus on haze. • Words – Air pollution and haze are caused by both mobile and stationary sources. Mobile sources include cars and trucks. Stationary sources include coal-fueled power plants and factories. Main types of air pollution are ozone (smog) and particulate matter • Websites to visit for background • http://www2.nature.nps.gov/air/AQBasics/sources.cfm • http://www.22september.org/info/en/air1.html • http://www.epa.gov/air/oaqps/eog/course422/ap3.html • Images to use: car, truck, factory, sun, cloud, pollution • Possible animations • Moving vehicles with rotating tires • Factory, car, truck putting out pollution • Sky turning hazy
What Causes Haze (Section2)WhatCausesHaze2Components • Goals- Two main air pollutants, then describe ozone • Words – There are two main air pollutants, ozone and particulate matter. Ozone is a corrosive gas formed when Volatile Organic Compounds (VOC) reacts with nitrogen oxides (NOx) in the presence of sunlight. • Websites to visit for background • http://www.cabq.gov/airquality/ozoneformation.html • http://www.airtrust.org • Images to use: car, truck, factory, sun, cloud, pollution, molecules, magnifying glass • Possible animations • Factory, car, truck putting out pollution • Zoom into pollution with magnifying glass • Molecules moving around • Nitrous oxides and Volatile Organic Compounds mixing with oxygen in the presence of sunlight to form Ozone
What Causes Haze (Section 2)WhatCausesHaze3Details • Goals – Describe particulate matter and what it’s composition is. • Words – “Particulate matter is a mixture of solid particles and liquid droplets found in the air and include dust, dirt, soot, smoke, and water vapor. These very small particles are formed by chemical reactions in the atmosphere. The sources of these pollutants include coal and other fuel combustion, metal processing, and farming activities. Sulfate is the most common particulate in the eastern United States.” • Websites to visit for background • http://www.wncair.org/Agency/air_monitoring.htm • http://www.epa.gov/oar/particlepollution/ • Images to use: Magnifying Glass, Molecules, graph pieces, pollution, Pie pieces • Possible animations • Molecules moving around • Zoom into sulfate • Build pie chart graph
Section 3 – What Causes Haze (Part 2) • Modules • Impact of weather and humidity on haze • National variations in haze and why the east is worse than the west • Inversion and its impact
What Causes Haze (Section3)WhatCausesHaze4WeatherImpact • Goals – Show that weather and humidity have a strong impact on haze. Therefore, haze is usually worse in the summer. • Words – There are seasonal variations in haze and associated visibility. Haze is usually worse in the summer because of greater humidity and heat. Humidity makes the haze worse because there are more water particles in the air that other things can cling to. The heat from the sun is greater during the summer and generates more ozone. • Websites to visit for background: • http://www.tva.gov/environment/air/ontheair/fine_particles_smokies.htm • http://www.ladco.org/reports/rpo/rhreport.pdf • Images to use: visibility graph, sun, water droplet, AshevilleHazy, AshevilleClear • Possible animations • Sun and water vapor droplet bigger in summer, smaller in winter • Water molecules bonding with others • Picture getting hazier
What Causes Haze (Section 3)WhatCausesHaze5NationalVariations • Goals – Explain why haze is worse in the Eastern US • Words – “Why is the west better than the east? Three main reasons – it is drier in the west (haze is worse with higher humidity), there are fewer sources of pollution, and the prevailing winds carry pollution eastward. Typical visual range in the western U.S. is 60 to 90 miles, or about one-half of what it would be without air pollution. In the East, the typical visual range is 15 to 30 miles, or about one-third of the visual range under natural conditions” • Websites to visit for background http://www2.nature.nps.gov/air/pubs/npspost/vis.htm • Images to use: USMap, USMapHazy, factory, car, truck, pollution, waterDroplet, Wind • Possible animations • Sources of pollution • More water droplets in east • Wind blowing to east • Make the east “hazy”
What Causes Haze (Section 3)WhatCausesHaze6Inversions • Goals – Show what inversion is and why it causes haze. • Words – “Inversions can make haze worse. A temperature inversion is when atmospheric temperatures increase with height rather than decrease as normal. Inversions prevent vertical air movement and trap pollution in mountain valleys. If you live close to a industrial or energy-generating plant, then local levels of air pollution can be bad during an inversion” • Websites to visit for background • http://www2.nature.nps.gov/air/AQBasics/visibility.cfm • http://www.cabq.gov/airquality/tempinversion1.html • Images to use: inversion series, sun, factory, pollution, GrantGoodgeImage • Possible animations • Turn on inversion • Emit pollution • Trap smoke under inversion • Turn hazy
Section 4 – How do we measure haze? • Modules • Visual impairment caused by scattering of light • Physical measurement of particulate matter • Visual measurement and construction of haze images
How do we measure haze (Section 4)HowMeasureHaze1Overview • Goals – Haze is caused by scattering of light, making the view less clear. • Words – “Haze is caused by absorption and scattering of light by particles and gases in the atmosphere. The visibility of an image is reduced when the particles scatter light and do not let the observer see the entire scene. This is very similar to trying to see through a dirty window – the dirt on the window obscures and scatters some of the light.” • Websites to visit for background • http://www2.nature.nps.gov/air/AQBasics/visibility.cfm • http://www.phoenixvis.net/education.html • Images to use: landmountainswithRiverSky, sun, clouds, tree, hiker • Possible animations • Clouds moving • Turn hazy • Arrows to mountain and back
How is haze measured (Section 4)HowMeasureHaze2Instruments • Goals – Show that there are nationwide sampling stations where haze particles are physically collected and measured. • Words – “Particulate matter is physically collected in a Particle Monitor. A pump pulls the air in and filters out the particles. The filter is examined to determine how much and what types of particulate matter were in the air sample. There are many sampling stations located across the country.” • Websites to visit for background • http://www.wncair.org/Agency/air_monitoring.htm - local in Buncombe county • http://www.epa.gov/ORD/NRMRL/Pubs/625R02012/625R02012cha/625R02012chap3.pdf • SLAMS locations • Images to use: SLAMSLocations, arrows, particles, cylinder, filter • Possible animations • Move air through canister • Open canister • Remove particles • Examine with Magnifying glass • Have national map zoom in.
How do we measure Haze (Section4)HowMeasureHaze3Visual • Goals – Show that there is a gradual degradation of visibility tied to a Haze Index. • Words – “Visual images are created using known haze conditions and related visibility degradation. A Haze Index is created, which is the furthest distance a person can see a dark object against a light background. The greater the particulate matter, the worse the visibility. ” • Websites to visit for background: • http://www.air-resource.com/modeling.php • http://www2.nature.nps.gov/air/AQBasics/visibility.cfm • Images to use: • GrandCanyonClear • GrandCanyonHazy • Magnifying glass • Particles • Pollution • Possible animations • Zoom in to show difference in far view • Put particles, etc. on top of picture to make it hazy
Section 5 – What is a haze forecast? • Modules • AQI index and its health implications • AQI maps and how they are different from haze forecast maps • Construction of a haze forecast map
What is a haze forecast (Section 5)WhatHazeForecast1AQIOverview • Goals – Introduce what AQI is and how it impacts health • Words – “The Air Quality Index (AQI) is an index for reporting daily air quality. It tells you how clean or polluted your air is, and what associated health effects might be a concern for you. The higher the AQI value, the greater the level of air pollution and the greater the health concern. ” • Websites to visit for background: • http://www.wncair.org/Ozone/ozone_forecast.htm#Forecast • http://www.fs.fed.us/pnw/fera/nfp/haze/emission_dispersion_module.html • http://airnow.gov/index.cfm?action=static.aqi • Images to use: • AQI Index • Hiker Coughing • Possible animations • Build the chart • As the chart advances, make the sky turn hazier and the hiker cough
What is a haze forecast (Section 5)WhatHazeForecast2AQIMap • Goals – How to read an Air Quality Map • Words – “Air Quality Index (AQI) Maps are Ozone and Particulate Matter Forecast Maps. These maps are good, but don’t show all of the impacts of air pollution on visibility .” • Websites to visit for background: • http://www.wncair.org/Ozone/ozone_forecast.htm#Forecast • http://www.fs.fed.us/pnw/fera/nfp/haze/emission_dispersion_module.html • http://www.airnow.gov/ • Images to use: • AQI maps • AQI Index • Possible animations • Start with an Air Quality map • Compare to another map
What is a haze forecast (Section5)WhatHazeForecast3Calculate • Goals – Show that a Haze Forecast map is different than an Air Quality Map. • Words – “Scientists must add data from other sources to create a haze forecast. The haze forecast maps are made from models that include data from AQI forecasts, weather forecasts and other sources. Windy conditions clear haze ” • Websites to visit for background: • www.cmascenter.org • http://www.hpc.ncep.noaa.gov/noaa/noaa.gif • Images to use: • AQI maps • Wind Map • Weather Map • Haze Map • All for Jan.11, 2006 • Possible animations • Start with an Air Quality map • Compare to weather map • Show wind arrows • Show Haze Map and wind blowing away
Section 6 – How can we improve? (Part 1) • Modules • Changes in driving habits and mobile sources • Cleaning up stationary sources (industrial) • Cleaning up stationary sources (domestic)
How can we improve (Section 6)HowImprove1Mobile • Goals – By changing our driving habits we can improve air quality and visibility • Words – “One of the main sources of haze and related air pollution are vehicles. To lessen pollution, make sure your vehicle passes emission testing standards for you area. Also, consider buying a more fuel efficient car or hybrid the next time you are replacing your car. ” • Websites to visit for background: • http://www.daq.state.nc.us/news/brochures/smokewheels.pdf • Images to use: • OldTruck • NewTruck • Exhaust • Pollution • Hybrid car • Battery • Lightning • Possible animations • Old car changing to new car • Old car emitting less smoke • Car with battery and electric sparks
How can we improve (Section 6)HowImprove2StationaryIndustrial • Goals – Progress is being made in stationary sources. Local power plants are installing new equipment. • Words – “Progress is being made in stationary sources. Power plants are installing scrubbers and new stacks to reduce emissions. Here in Asheville, the local power plant generates electricity by burning coal. They have recently installed new emission control devices and substantially reduced pollution.” • Websites to visit: • http://www.progress-energy.com/environment/programs/airquality/asheville.asp • Images to use: factory, pollution • Possible Animations • Less smoke from factory/power plant • Tear down one smoke stack and put up cleaner one
How can we improve (Section 6)HowImprove2StationaryHome • Goals – Progress can be made at home as well. Retrofits on woodstoves and controlling outdoor burning. • Words - Other points sources are homes with wood stoves. Install retrofits. • Websites to visit: • Images to use: house, cylinder, pollution • Possible Animations • Less smoke from house • Wood stove morph • Burn barrel
Section 7 – How can we improve? (Part 2) • Modules • Alternate energy sources • Wind power technology • Solar power technology
How can we improve (Section 7)HowImprove4AlternateEnergy • Goals – Introduce alternate energy sources. Words – “Alternate energy sources are cleaner and produce less pollution. Many of them are also renewable. Renewable energy sources include Wood, Biomass, Hydropower, Solar energy, Wind energy, Wave energy, Tidal power, Nuclear Fusion, and Ocean thermal energy conversion” • Websites to visit: • http://www.eere.energy.gov/ • http://www.cleanair.org/Energy/alternativeEnergy.html • Images to use: • Sun • Wind turbine • Water • Earth • Trees • Lightning • Possible animations • Images popping up and then rotating around each other to create energy
How can we improve (Section 7)HowImprove5Wind • Goals –Introduce the local use of wind power • Words – “One possibility that is now being considered for Western North Carolina is wind Power. The wind turbines could be located on hillsides which have a greater amount of wind. One problem with wind turbines is the visual impact that have on the scenery.” • Websites to visit • http://www.windpower.org/en/core.htm • http://www.awea.org/ • Images to use – wind turbine, hillsides, wind • Possible animations • Wind turbines on hillside • Spinning caused by wind
How can we improve (Section 7)HowImprove6Solar • Goals – Solar power basics and applications • Words – Solar energy does not produce air pollution and is renewable. It can also be installed for single housing units or larger installation. The current cost of installation is still high, but with increasing energy costs it is becoming a more affordable energy option.” • Websites to visit • http://www.naturalhub.com/food_issues_food_supply_security_alternative_energy.htm • http://www.nrel.gov/ • Images to use – sun, solar panel • Possible animations • Sun striking solar panel • Panel absorbing heat • Heat warming water • Water making electricity