Download
1 / 17
170 likes | 271 Vues
Explore space-time dynamics of West Nile Virus using DYCAST system analysis to understand the relationship between bird activity and human infections. Utilize risk histories for deep insights.

E N D
Visualization of space-time patterns of West Nile virus Alan McConchie CPSC 533c: Information Visualization November 15, 2006
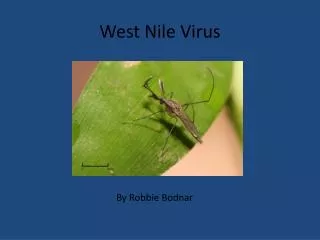
West Nile Virus • Introduced in North America in 1999 • Transmitted by mosquitoes • These mosquito species are highly ornithiphilic • Corvids (crows, jays) are primary reservoir • High mortality • Amplification cycle as mosquitoes feed on infected birds • Humans infected by mosquitoes as a side-effect • Theorized spillover effect as birds die off and mosquitoes switch to feeding on humans • Would result in observable lag between bird deaths and human infections
West Nile Virus Source: The Centers for Disease Control and Prevention; http://www.cdc.gov/ncidod/dvbid/westnile/cycle.htm
Dynamics of WNV in the field • Public reporting of dead birds can be used to track WNV activity • DYCAST (Dynamic Continuous-Area Space-Time) system • Identifies clusters of dead birds within lattice cells • Result: daily raster map of WNV activity • WNV activity = high risk of human infection • Binary risk/no risk classification (“lit” / ”not lit”)
Analysis problems • What is the relationship between WNV activity in birds and human cases of WNV? • What patterns of WNV activity are predictors of human cases? • Do different areas have different relationship between WNV activity and human cases? • Lag between dead birds and human onset may vary according to climate, population density, etc
Scientific Visualization vs Information Visualization • The visual representation is given (x, y and t) • However, animation or 3D visualization is difficult to use • Similarities may not be adjacent in space or time • Other forms of juxtaposition are necessary • Use a derived variable, or in this case, a time-series • Human case “risk histories” • Sequence of daily risk values for the cell in which a human occurs
Risk Histories X dimension: time Y dimension: individual human cases Red: risk Black: no risk Blue: date of human onset
Risk Histories Sorted according to number of lit cells
Risk Histories Sorted according to date of human onset
Risk Histories Sorted according to date of first risk
Risk Histories Shifted to align human onsets
Extracting Meaning: What Good Is It? • Are similar risk histories spatially correlated? If so, what underlying circumstances do they have in common? • Phase one: use linked views to explore spatial relationships • Phase two: use automated clustering to discover similarities in risk histories
Project Progress Summary • Completed goals: • Command-line utilities to extract risk histories • Implement sorting • In progress: • Select visualization toolkit, assemble layout • To do: • Develop interface between toolkit and command-line • Create linkages between views • Clustering of risk histories